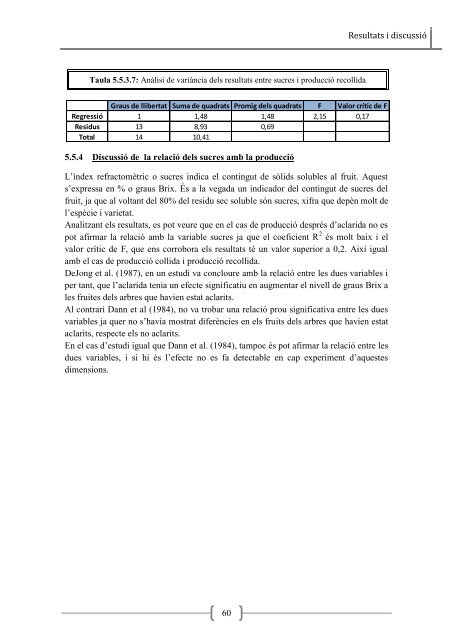
Tau<strong>la</strong> 5.5.3.7: Anàlisi <strong>de</strong> variància <strong><strong>de</strong>ls</strong> resultats entre sucres i producció recollida Graus <strong>de</strong> llibertat Suma <strong>de</strong> quadrats Promig <strong><strong>de</strong>ls</strong> quadrats F Valor crític <strong>de</strong> F Regressió 1 1,48 1,48 2,15 0,17 Residus 13 8,93 0,69 Total 14 10,41 5.5.4 Discussió <strong>de</strong> <strong>la</strong> re<strong>la</strong>ció <strong><strong>de</strong>ls</strong> sucres amb <strong>la</strong> producció 60 Resultats i discussió L’ín<strong>de</strong>x refractomètric o sucres indica el contingut <strong>de</strong> sòlids solubles al fruit. Aquest s’expressa en % o graus Brix. És a <strong>la</strong> vegada un indicador <strong>de</strong>l contingut <strong>de</strong> sucres <strong>de</strong>l fruit, ja que al voltant <strong>de</strong>l 80% <strong>de</strong>l residu sec soluble són sucres, xifra que <strong>de</strong>pèn molt <strong>de</strong> l’espècie i varietat. Analitzant els resultats, es pot veure que en el cas <strong>de</strong> producció <strong>de</strong>sprés d’ac<strong>la</strong>rida no es pot afirmar <strong>la</strong> re<strong>la</strong>ció amb <strong>la</strong> variable sucres ja que el coeficient R 2 és molt baix i el valor crític <strong>de</strong> F, que ens corrobora els resultats té un valor superior a 0,2. Així igual amb el cas <strong>de</strong> producció collida i producció recollida. DeJong et al. (1987), en un estudi va concloure amb <strong>la</strong> re<strong>la</strong>ció entre les dues variables i per tant, que l’ac<strong>la</strong>rida tenia un efecte significatiu en augmentar el nivell <strong>de</strong> graus Brix a les fruites <strong><strong>de</strong>ls</strong> <strong>arbres</strong> que havien estat ac<strong>la</strong>rits. Al contrari Dann et al (1984), no va trobar una re<strong>la</strong>ció prou significativa entre les dues variables ja quer no s’havia mostrat diferències en els fruits <strong><strong>de</strong>ls</strong> <strong>arbres</strong> que havien estat ac<strong>la</strong>rits, respecte els no ac<strong>la</strong>rits. En el cas d’estudi igual que Dann et al. (1984), tampoc és pot afirmar <strong>la</strong> re<strong>la</strong>ció entre les dues variables, i si hi és l’efecte no es fa <strong>de</strong>tectable en cap experiment d’aquestes dimensions.
5.5.5 Re<strong>la</strong>ció aci<strong>de</strong>sa - producció 61 Resultats i discussió En aquest cas s’estudia <strong>la</strong> possible re<strong>la</strong>ció entre les produccions obtingu<strong>de</strong>s i l’aci<strong>de</strong>sa en els fruits associats. S’estudia <strong>la</strong> re<strong>la</strong>ció lineal [y=ax+b] entre ambdues variables prenent com a variable in<strong>de</strong>pen<strong>de</strong>nt <strong>la</strong> producció [kg/ha] i <strong>la</strong> <strong>de</strong>pen<strong>de</strong>nt l’aci<strong>de</strong>sa [g/l àcid màlic]. El valor final obtingut <strong>de</strong> l’aci<strong>de</strong>sa, és el resultat <strong>de</strong> <strong>la</strong> pon<strong>de</strong>ració <strong>de</strong> 3 mesures (una en cada passada) d’acord amb <strong>la</strong> producció recollida a cada passada. La pon<strong>de</strong>ració es pot veure a <strong>la</strong> tau<strong>la</strong> 5.9.1. Els resultats es po<strong>de</strong>n veure a l’arxiu ...\ACIDESA.xls. Tau<strong>la</strong> 5.5.5.1: Pon<strong>de</strong>ració <strong>de</strong> l’aci<strong>de</strong>sa d’acord amb <strong>la</strong> producció recollida a cada passada en cada un <strong><strong>de</strong>ls</strong> <strong>arbres</strong> estudiats Fi<strong>la</strong> Arbre 1ª passada %1ª passada 2ª passada %2ª passada 3ª passada %3ª passada Producció recollida Producció prevista <strong>de</strong>sprés d’ac<strong>la</strong>rida PRODUCCIÓ (kg/ha) ACIDESA 1ª passada 2ª Passada 3ª Passada En <strong>la</strong> tau<strong>la</strong> i figura següent es mostren els resultats obtinguts en cada un <strong><strong>de</strong>ls</strong> <strong>arbres</strong>, les variables: producció prevista <strong>de</strong>sprés d’ac<strong>la</strong>rida [t/ha] i l’aci<strong>de</strong>sa <strong><strong>de</strong>ls</strong> fruits corresponents [g/l àcid màlic]. Pon<strong>de</strong>ració 1ª, 2ª i 3ª passada 1 2 7669,99 16% 42052,15 70% 8467,99 14% 58190,13 5,06 5,41 5,63 5,38536316 3 4639,76 23% 19469,29 63% 3412,37 15% 27521,42 5,06 5,34 5,7 5,32991392 4 2106,84 14% 17491,91 65% 3570,84 21% 23169,59 4,84 5,41 5,13 5,270022048 5 1766,69 10% 14946,83 76% 2404,22 14% 19117,74 5,2 5,77 6,05 5,750148078 7 6628,38 24% 19731,84 68% 2677,53 8% 29037,75 5,2 5,91 5,77 5,725988749 8 5512,91 21% 19038,91 60% 5629,99 19% 30181,81 5,41 5,77 4,99 5,544633774 9 8090,91 67% 5810,3 33% 0 0% 13901,21 4,84 4,91 0 4,863090002 10 3407,38 8% 25766,3 78% 3309,53 14% 32483,21 5,77 4,99 4,91 5,042872893 2 1 11154,76 52% 17406,45 48% 188,84 0% 28750,05 4,49 5,2 0 4,833472733 3 11047,53 18% 10699,6 55% 4714,07 27% 26461,2 5,06 5,41 5,63 5,404301115 5 3764,3 10% 12241,84 74% 2479,3 16% 18485,44 4,41 5,41 5,48 5,320311974 6 10427,3 35% 15348,46 56% 3712,3 8% 29488,06 4,06 5,2 5,06 4,786170721 8 10063,84 59% 9111,3 41% 668 0% 19843,14 4,41 4,77 0 4,557378899 9 4959,68 22% 14820,07 61% 3271,3 17% 23051,05 4,7 4,77 5,13 4,814727355 11 10672,6 25% 28613,53 69% 2093,61 5% 41379,74 4,34 4,49 4,34 4,444088572
- Page 1 and 2:
UNIVERSITAT DE LLEIDA Escola Tècni
- Page 3 and 4:
3.2 Objectius .....................
- Page 5 and 6:
5.5.6 Discussió de la relació de
- Page 7 and 8:
1. INTRODUCCIÓ 1.1 Pròleg De l’
- Page 9 and 10:
Pel que fa la evolució de producci
- Page 11 and 12:
Cal destacar que amb el terme prés
- Page 13 and 14:
2. ANTECEDENTS 2.1 Introducció 6 A
- Page 15 and 16:
8 Antecedents DeJong et al., 1989).
- Page 17 and 18:
10 Antecedents en l’embrió, pode
- Page 19 and 20: Mètodes d’anàlisi de sucres 12
- Page 21 and 22: 2.2.2 Mesures no destructives 14 An
- Page 23 and 24: 2.3.2 Creixement en doble sigmoide
- Page 25 and 26: 18 Antecedents través del diàmetr
- Page 27 and 28: 20 Antecedents la distribució dels
- Page 29 and 30: 3. FINALITAT I OBJECTIUS 3.1 Finali
- Page 31 and 32: 4. MATERIAL I MÈTODES 4.1 Caracter
- Page 33 and 34: 24 Material i mètodes pot veure le
- Page 35 and 36: 26 Material i mètodes El fòsfor,
- Page 37 and 38: 28 Material i mètodes tracta d’u
- Page 39 and 40: 4.1.5.5 Aclarida L’aclarida es va
- Page 41 and 42: Taula 4.2.3.1: Secció de tronc del
- Page 43 and 44: 34 Material i mètodes fermesa fore
- Page 45 and 46: Producció 36 Material i mètodes P
- Page 47 and 48: Figura 4.4.2.3: Talls obtinguts un
- Page 49 and 50: Determinació de sucres i acidesa 4
- Page 51 and 52: 4.5 Estudi estadístic 42 Material
- Page 53 and 54: 5. RESULTATS I DISCUSSIÓ 5.1 Nomen
- Page 55 and 56: Taula 5.2.3.1: Nombre de fruits pre
- Page 57 and 58: PES [gr] 400 350 300 250 200 150 10
- Page 59 and 60: 5.5 Resultats de l’experiència 2
- Page 61 and 62: Calibre [mm] 90 80 70 60 50 40 30 2
- Page 63 and 64: Calibres [mm] 90 80 70 60 50 40 30
- Page 65 and 66: 5.5.3 Relació sucres - producció
- Page 67 and 68: Taula 5.5.3.3: Anàlisi de variànc
- Page 69: Sucres [ºbrix] 16,50 16,00 15,50 1
- Page 73 and 74: Taula 5.5.5.3: Anàlisi de variànc
- Page 75 and 76: Acidesa [g/l àcid màlic] 7,00 6,0
- Page 77 and 78: 5.5.7 Relació número de fruits -
- Page 79 and 80: Producció recollida [t/ha] 70,00 6
- Page 81 and 82: 5.5.9 Relació secció de tronc - d
- Page 83 and 84: Pes dels fruits [g] 300,00 250,00 2
- Page 85 and 86: 6. CONCLUSIONS ....................
- Page 87 and 88: 7. BIBLIOGRAFIA ...................
- Page 89 and 90: Chapman, G.W.; Hovart, R.J.; Forbus
- Page 91 and 92: Leopold, A.C.; Kriedemann, P.E. 197
- Page 93 and 94: Westwood, M.N. 1962. Seasonal chang
- Page 95 and 96: 8. ANNEXES 8.1 Plànol de localitza
- Page 97 and 98: 8.3 Recull de dades de mesures i an
- Page 99 and 100: nº fruit 8.4 Registre dels valors
- Page 101 and 102: 8,8 330 8 273,5 7,8 247,6 7,9 273,4
- Page 103 and 104: 7,55 226,4 7,85 254 8,1 275,6 7,7 2
- Page 105: Rank 1 Eqn 8001 potencial(a,b) r 2