

Evaluación de impacto plan de descontaminación mayo de 2010
Evaluación de impacto plan de descontaminación mayo de 2010
Evaluación de impacto plan de descontaminación mayo de 2010

You also want an ePaper? Increase the reach of your titles
YUMPU automatically turns print PDFs into web optimized ePapers that Google loves.
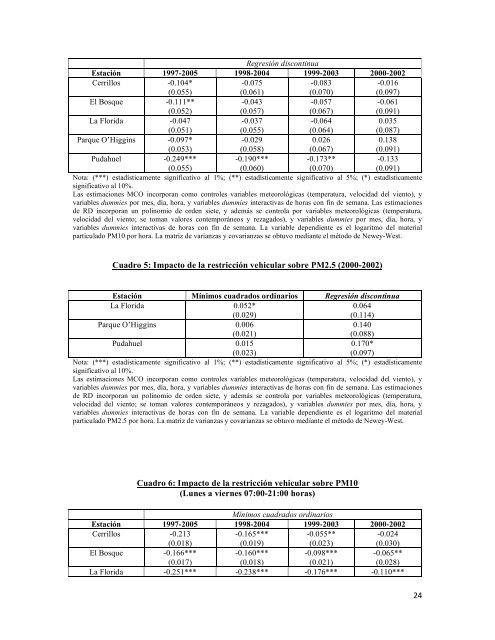
Regresión discontinua<br />
Estación 1997-2005 1998-2004 1999-2003 2000-2002<br />
Cerrillos -0.104*<br />
-0.075<br />
-0.083<br />
-0.016<br />
(0.055)<br />
(0.061)<br />
(0.070)<br />
(0.097)<br />
El Bosque -0.111**<br />
-0.043<br />
-0.057<br />
-0.061<br />
(0.052)<br />
(0.057)<br />
(0.067)<br />
(0.091)<br />
La Florida -0.047<br />
-0.037<br />
-0.064<br />
0.035<br />
(0.051)<br />
(0.055)<br />
(0.064)<br />
(0.087)<br />
Parque O’Higgins -0.097*<br />
-0.029<br />
0.026<br />
0.138<br />
(0.053)<br />
(0.058)<br />
(0.067)<br />
(0.091)<br />
Pudahuel -0.249*** -0.190*** -0.173**<br />
-0.133<br />
(0.055)<br />
(0.060)<br />
(0.070)<br />
(0.091)<br />
Nota: (***) estadísticamente significativo al 1%; (**) estadísticamente significativo al 5%; (*) estadísticamente<br />
significativo al 10%.<br />
Las estimaciones MCO incorporan como controles variables meteorológicas (temperatura, velocidad <strong>de</strong>l viento), y<br />
variables dummies por mes, día, hora, y variables dummies interactivas <strong>de</strong> horas con fin <strong>de</strong> semana. Las estimaciones<br />
<strong>de</strong> RD incorporan un polinomio <strong>de</strong> or<strong>de</strong>n siete, y a<strong>de</strong>más se controla por variables meteorológicas (temperatura,<br />
velocidad <strong>de</strong>l viento; se toman valores contemporáneos y rezagados), y variables dummies por mes, día, hora, y<br />
variables dummies interactivas <strong>de</strong> horas con fin <strong>de</strong> semana. La variable <strong>de</strong>pendiente es el logaritmo <strong>de</strong>l material<br />
particulado PM10 por hora. La matriz <strong>de</strong> varianzas y covarianzas se obtuvo mediante el método <strong>de</strong> Newey-West.<br />
<br />
Cuadro 5: Impacto <strong>de</strong> la restricción vehicular sobre PM2.5 (2000-2002)<br />
Estación Mínimos cuadrados ordinarios Regresión discontinua<br />
La Florida 0.052*<br />
0.064<br />
(0.029)<br />
(0.114)<br />
Parque O’Higgins 0.006<br />
0.140<br />
(0.021)<br />
(0.088)<br />
Pudahuel 0.015<br />
0.170*<br />
(0.023)<br />
(0.097)<br />
Nota: (***) estadísticamente significativo al 1%; (**) estadísticamente significativo al 5%; (*) estadísticamente<br />
significativo al 10%.<br />
Las estimaciones MCO incorporan como controles variables meteorológicas (temperatura, velocidad <strong>de</strong>l viento), y<br />
variables dummies por mes, día, hora, y variables dummies interactivas <strong>de</strong> horas con fin <strong>de</strong> semana. Las estimaciones<br />
<strong>de</strong> RD incorporan un polinomio <strong>de</strong> or<strong>de</strong>n siete, y a<strong>de</strong>más se controla por variables meteorológicas (temperatura,<br />
velocidad <strong>de</strong>l viento; se toman valores contemporáneos y rezagados), y variables dummies por mes, día, hora, y<br />
variables dummies interactivas <strong>de</strong> horas con fin <strong>de</strong> semana. La variable <strong>de</strong>pendiente es el logaritmo <strong>de</strong>l material<br />
particulado PM2.5 por hora. La matriz <strong>de</strong> varianzas y covarianzas se obtuvo mediante el método <strong>de</strong> Newey-West.<br />
Cuadro 6: Impacto <strong>de</strong> la restricción vehicular sobre PM10<br />
(Lunes a viernes 07:00-21:00 horas)<br />
Mínimos cuadrados ordinarios<br />
Estación 1997-2005 1998-2004 1999-2003 2000-2002<br />
Cerrillos -0.213<br />
-0.165*** -0.055**<br />
-0.024<br />
(0.018)<br />
(0.019)<br />
(0.023)<br />
(0.030)<br />
El Bosque -0.166*** -0.160*** -0.098*** -0.065**<br />
(0.017)<br />
(0.018)<br />
(0.021)<br />
(0.028)<br />
La Florida -0.251*** -0.238*** -0.176*** -0.110***<br />
24