Plan de Prevención y Descontaminación de la Región ... - Sofofa
Plan de Prevención y Descontaminación de la Región ... - Sofofa
Plan de Prevención y Descontaminación de la Región ... - Sofofa

Create successful ePaper yourself
Turn your PDF publications into a flip-book with our unique Google optimized e-Paper software.
En el grupo correspondiente a “otras fuentes”, <strong>la</strong>s proyecciones se hicieron con diferentes<br />
tasas. Para <strong>la</strong>s emisiones provenientes <strong>de</strong> combustión resi<strong>de</strong>ncial, uso <strong>de</strong> solventes<br />
domésticos y emisiones evaporativas <strong>de</strong> COV se usaron tasas re<strong>la</strong>cionadas con el<br />
crecimiento esperado <strong>de</strong>l PIB. Para quemas, incendios y emisiones biogénicas se supuso que<br />
se mantendrá el promedio <strong>de</strong> emisiones <strong>de</strong> los últimos cuatro años.<br />
Es importante <strong>de</strong>stacar que <strong>la</strong> estimación <strong>de</strong> los kilómetros recorridos en el escenario 2005,<br />
calcu<strong>la</strong>da en base a los flujos <strong>de</strong>l <strong>P<strong>la</strong>n</strong> <strong>de</strong> Desarrollo <strong>de</strong>l Sistema <strong>de</strong> Transporte, arroja tasas<br />
<strong>de</strong> crecimiento <strong>de</strong>l consumo <strong>de</strong> gasolinas <strong>de</strong>l or<strong>de</strong>n <strong>de</strong>l 4 % anual para el período 1997-<br />
2005, cifra que parece más bien conservadora si se consi<strong>de</strong>ra que <strong>la</strong> tasa actual varía entre el<br />
7 y 10 %. Lo anterior hace suponer que el nivel <strong>de</strong> emisiones <strong>de</strong> fuentes móviles, para el<br />
escenario base 2005, está subestimada.<br />
La metodología utilizada para calcu<strong>la</strong>r <strong>la</strong> estimación <strong>de</strong> emisiones futuras pue<strong>de</strong> consultarse<br />
en el documento “Inventario <strong>de</strong> Emisiones Atmosféricas <strong>de</strong> <strong>la</strong> <strong>Región</strong> Metropolitana para<br />
1997 y proyecciones al 2005”, CONAMA R.M. 1997, y es equivalente a <strong>la</strong> utilizada en <strong>la</strong><br />
estimación <strong>de</strong>l inventario <strong>de</strong> emisiones <strong>de</strong> 1997 (ver capítulo 3).<br />
El resultado <strong>de</strong> <strong>la</strong>s proyecciones antes mencionadas, se presenta en <strong>la</strong> Tab<strong>la</strong> .4.1(página 4-<br />
2).<br />
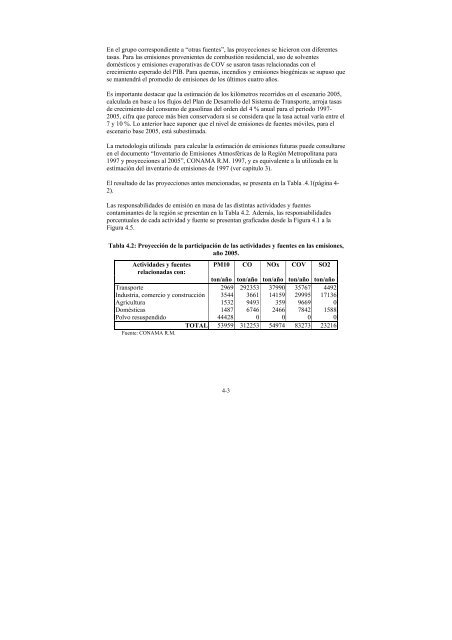
Las responsabilida<strong>de</strong>s <strong>de</strong> emisión en masa <strong>de</strong> <strong>la</strong>s distintas activida<strong>de</strong>s y fuentes<br />
contaminantes <strong>de</strong> <strong>la</strong> región se presentan en <strong>la</strong> Tab<strong>la</strong> 4.2. A<strong>de</strong>más, <strong>la</strong>s responsabilida<strong>de</strong>s<br />
porcentuales <strong>de</strong> cada actividad y fuente se presentan graficadas <strong>de</strong>s<strong>de</strong> <strong>la</strong> Figura 4.1 a <strong>la</strong><br />
Figura 4.5.<br />
Tab<strong>la</strong> 4.2: Proyección <strong>de</strong> <strong>la</strong> participación <strong>de</strong> <strong>la</strong>s activida<strong>de</strong>s y fuentes en <strong>la</strong>s emisiones,<br />
año 2005.<br />
Activida<strong>de</strong>s y fuentes<br />
re<strong>la</strong>cionadas con:<br />
PM10 CO NOx COV SO2<br />
ton/año ton/año ton/año ton/año ton/año<br />
Transporte 2969 292353 37990 35767 4492<br />
Industria, comercio y construcción 3544 3661 14159 29995 17136<br />
Agricultura 1532 9493 359 9669 0<br />
Domésticas 1487 6746 2466 7842 1588<br />
Polvo resuspendido 44428 0 0 0 0<br />
TOTAL<br />
Fuente: CONAMA R.M.<br />
53959 312253 54974 83273 23216<br />
4-3