- Page 1 and 2: COMISION NACIONAL DEL MEDIO AMBIENT
- Page 3 and 4: 5.2 DEFINICIÓN DE LAS METAS GLOBAL
- Page 5 and 6: CAPÍTULO 1 INTRODUCCIÓN.
- Page 7 and 8: Es necesario destacar que estos pro
- Page 9 and 10: describe en el capítulo respectivo
- Page 11 and 12: CAPÍTULO 2 DIAGNÓSTICO.
- Page 13 and 14: A continuación se resumen los prin
- Page 15 and 16: 2.1.5 Ozono: O3 Este contaminante s
- Page 17 and 18: Cuando los dos tipos de inversiones
- Page 19 and 20: indica, o bien la expansión del á
- Page 21 and 22: 2.2.3.4 Parque vehicular en la Regi
- Page 23 and 24: 2.3 Antecedentes que fundaron la de
- Page 25 and 26: Figura 2.3: Porcentaje de norma, va
- Page 27 and 28: diámetro está comprendido entre 1
- Page 29 and 30: Figura 2.7: Concentraciones máxima
- Page 31 and 32: 150 100 50 0 Figura 2.9: Ozono. Dí
- Page 33 and 34: Los monitoreos de SO2 durante 1995
- Page 35 and 36: 3. ANTECEDENTES RELATIVOS A LAS ACT
- Page 37 and 38: corresponden a PTS, pero debido a q
- Page 39 and 40: De acuerdo a lo anterior y a la des
- Page 41 and 42: una zona agrorrural de la región.
- Page 43 and 44: Polvo Natural 6,37 (12,47%) Transpo
- Page 45 and 46: CAPÍTULO 4 LÍNEA BASE DE EMISIONE
- Page 47 and 48: procesos que no consumen combustibl
- Page 49: Figura 4.1 Responsabilidad en las e
- Page 53 and 54: CAPÍTULO 5 METAS DE REDUCCIÓN DE
- Page 55 and 56: ealizados toman como situación bas
- Page 57 and 58: Esta información ha sido usada en
- Page 59 and 60: Tabla 5.2: Cronograma de reducción
- Page 61 and 62: CAPÍTULO 6 INSTRUMENTOS DE GESTIÓ
- Page 63 and 64: Agricultura: LAC 2: Establecer meca
- Page 65 and 66: por lo cual son exigibles de acuerd
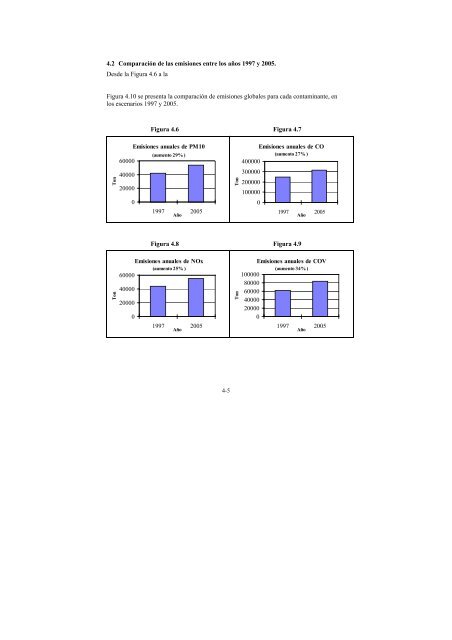
- Page 67 and 68: Tn/año 70000 60000 50000 40000 300
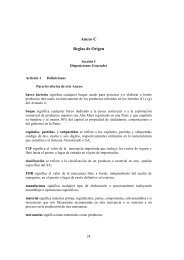
- Page 69 and 70: Tn/año 400000 350000 300000 250000
- Page 71 and 72: 6.4 Primera etapa del plan. 6.4.1 A
- Page 73 and 74: M3FMV 19 Modifícase el DS 211/92 d
- Page 75 and 76: M3TTE 3 El Ministerio de Transporte
- Page 77 and 78: M3FMV 6 El Ministerio de Transporte
- Page 79 and 80: M3FMV 21 Los vehículos de carga de
- Page 81 and 82: tomen sus decisiones de compra y vi
- Page 83 and 84: Tabla 6.5: Nuevas especificaciones
- Page 85 and 86: ESTRATEGIA 2. DEFINIR POLÍTICAS ES
- Page 87 and 88: Para ello, el Ministerio de Transpo
- Page 89 and 90: de Desarrollo del Sistema de Transp
- Page 91 and 92: ESTRATEGIA 3. INCORPORAR LA VARIABL
- Page 93 and 94: 1ª etapa: Estudiar y evaluar nueva
- Page 95 and 96: hasta llegar a una emisión meta po
- Page 97 and 98: Las fuentes estacionarias puntuales
- Page 99 and 100: procesos se regularán mediante nor
- Page 101 and 102:
Tabla 6.9 Tipo de Combustible Conce
- Page 103 and 104:
Como primer paso para la implementa
- Page 105 and 106:
las demás obligaciones aquí estab
- Page 107 and 108:
Tabla 6.12: Nuevas especificaciones
- Page 109 and 110:
M3FFJ 10 Las fuentes estacionarias
- Page 111 and 112:
gas de ciudad 15 biogas 15 gas natu
- Page 113 and 114:
a) Durante un tiempo de tres (3) mi
- Page 115 and 116:
M3EDI 3 El Ministerio de Vivienda y
- Page 117 and 118:
pavimentar, aumentando las emisione
- Page 119 and 120:
M1OTR 2 El Ministerio de Vivienda y
- Page 121 and 122:
M1OTR 13 Se deberá presentar un pr
- Page 123 and 124:
M4OTR 4 En los próximos tres años
- Page 125 and 126:
situaciones normales este criterio
- Page 127 and 128:
• Definición de una metodología
- Page 129 and 130:
M1OTR 13 proyecto de ley en virtud
- Page 131 and 132:
CAPÍTULO 7 PLAN OPERACIONAL PARA E
- Page 133 and 134:
Por otro lado, estudios realizados
- Page 135 and 136:
MEPC 1 El Ministerio de Transportes
- Page 137 and 138:
MEPC 9 Las autoridades competentes
- Page 139 and 140:
Los planes de reducción de emision
- Page 141 and 142:
CONAMA deberá coordinar la ejecuci
- Page 143 and 144:
4. Los organismos competentes, en l
- Page 145 and 146:
1. Los organismos competentes, en l
- Page 147 and 148:
operación y mantención, la incorp
- Page 149 and 150:
CAPÍTULO 8 PROGRAMA DE EDUCACIÓN
- Page 151 and 152:
Para ello se han definido las sigui
- Page 153 and 154:
intradomiciliaria y eventos de alta
- Page 155 and 156:
Su objetivo es introducir en la edu
- Page 157 and 158:
CAPÍTULO 9 ESTIMACIÓN DE COSTOS Y
- Page 159 and 160:
correspondientes, los cuales fueron
- Page 161 and 162:
El contaminante con más impactos e
- Page 163 and 164:
Tabla 9.3 resume estos resultados i
- Page 165 and 166:
esto de los subsectores (industria,
- Page 167 and 168:
que el PPDA evitará. De esta forma
- Page 169 and 170:
la mejora en la calidad del aire. E
- Page 171 and 172:
Como se observa de la clasificació
- Page 173 and 174:
M2CMB7 19,049,303 0.00% 0.00% 5.60%
- Page 175 and 176:
Agricultura Industria, comercio y c
- Page 177 and 178:
9.3.3 Resumen de costos. Los costos
- Page 179 and 180:
CAPÍTULO 10 FISCALIZACIÓN, VERIFI
- Page 181 and 182:
Carabineros de Chile, de las Munici
- Page 183 and 184:
10.3 Actualización del plan. El Pr
- Page 185 and 186:
Figura 10.1: Esquema del proceso de
- Page 187 and 188:
RESPONSABLES Y PARTICIPANTES EN LA
- Page 189 and 190:
Comité Operativo del PPDA de la Re
- Page 191 and 192:
SUBCOMITÉS TÉCNICOS - PLAN DE DES
- Page 193 and 194:
Javier García (CONAMA R.M.) Fernan
- Page 195 and 196:
Marco Mancilla , CNE Raúl O´Ryan,
- Page 197 and 198:
Gladys Barrero, Serv. Salud M del A
- Page 199 and 200:
YPF, Avda. El Bosque Norte 0177, pi