Informe 1/2007 - Ciudad Autónoma de Ceuta
Informe 1/2007 - Ciudad Autónoma de Ceuta
Informe 1/2007 - Ciudad Autónoma de Ceuta

Create successful ePaper yourself
Turn your PDF publications into a flip-book with our unique Google optimized e-Paper software.
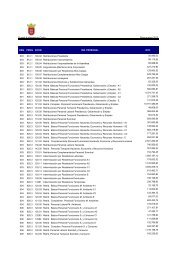
2500000<br />
2000000<br />
1500000<br />
1000000<br />
500000<br />
0<br />
2000 2001 2002 2003 2004 2005<br />
Mercancias cargadas<br />
Mercancías <strong>de</strong>scargadas<br />
Totales<br />
El tráfico <strong>de</strong> pasajeros ha tenido una evolución creciente <strong>de</strong>s<strong>de</strong> el año<br />
1995 hasta el 2000, produciéndose un <strong>de</strong>scenso constante <strong>de</strong>s<strong>de</strong><br />
entonces. Los vehículos transportados han tenido una evolución<br />
creciente hasta el año 2001, produciéndose un retroceso <strong>de</strong>s<strong>de</strong> el 2002<br />
hasta el 2004 y un pequeño repunte en el año 2005.<br />
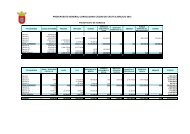
En cuanto a la evolución global <strong>de</strong> las mercancías es en líneas<br />
generales restrictiva, pasándose <strong>de</strong> 2.265.961 toneladas en el 2000 a<br />
las 1.543.459 toneladas en el 2005, pero si aten<strong>de</strong>mos exclusivamente a<br />
las mercancías transportadas hacia <strong>Ceuta</strong>, éstas llevan una evolución<br />
<strong>de</strong>creciente <strong>de</strong>s<strong>de</strong> el 2000 hasta el 2003, con pequeños repuntes en el<br />
2004 y 2005.<br />
El tráfico <strong>de</strong> camiones tiene una evolución creciente <strong>de</strong>s<strong>de</strong> 1989 hasta el<br />
2001, exceptuando un retroceso entre los años 1994 y 1995 y a partir<br />
<strong>de</strong>l año 2002 (coinci<strong>de</strong>nte con la crisis económica <strong>de</strong>rivada <strong>de</strong> los<br />
acontecimientos internacionales; terrorismo, etc) se producen vaivenes,<br />
pero con ten<strong>de</strong>ncia <strong>de</strong>scen<strong>de</strong>nte.<br />
Movimiento <strong>de</strong> vehículos industriales<br />
AÑOS CEUTA<br />
1989 33.453<br />
1990 34.742<br />
1991 38.011<br />
1992 36.356<br />
1993 38.394<br />
1994 41.975<br />
1995 39.804<br />
1996 35.721<br />
18