EL MENSUAL GANADERO - Bolsa de Cereales de Bahía Blanca
EL MENSUAL GANADERO - Bolsa de Cereales de Bahía Blanca
EL MENSUAL GANADERO - Bolsa de Cereales de Bahía Blanca

You also want an ePaper? Increase the reach of your titles
YUMPU automatically turns print PDFs into web optimized ePapers that Google loves.
El Mensual Gana<strong>de</strong>ro<br />
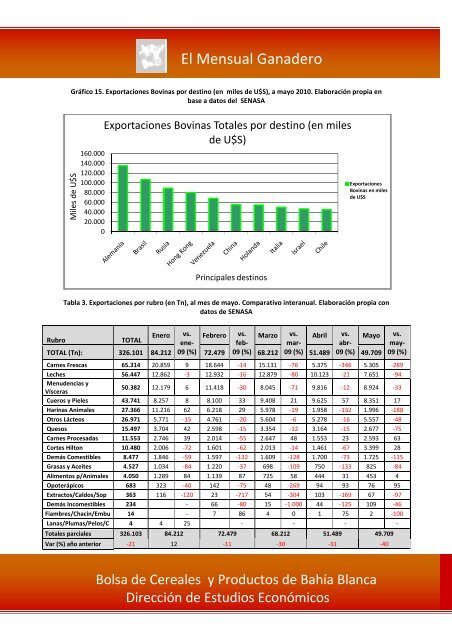
Gráfico 15. Exportaciones Bovinas por <strong>de</strong>stino (en miles <strong>de</strong> U$S), a mayo 2010. Elaboración propia en<br />
base a datos <strong>de</strong>l SENASA<br />
Miles <strong>de</strong> U$S<br />
160.000<br />
140.000<br />
120.000<br />
100.000<br />
80.000<br />
60.000<br />
40.000<br />
20.000<br />
0<br />
Exportaciones Bovinas Totales por <strong>de</strong>stino (en miles<br />
<strong>de</strong> U$S)<br />
Principales <strong>de</strong>stinos<br />
Exportaciones<br />
Bovinas en miles<br />
<strong>de</strong> U$S<br />
Tabla 3. Exportaciones por rubro (en Tn), al mes <strong>de</strong> mayo. Comparativo interanual. Elaboración propia con<br />
datos <strong>de</strong> SENASA<br />
Rubro TOTAL<br />
Enero vs.<br />
ene-<br />
Febrero vs.<br />
feb-<br />
Marzo vs.<br />
mar-<br />
Abril vs.<br />
abr-<br />
Mayo<br />
TOTAL (Tn): 326.101 84.212 09 (%) 72.479 09 (%) 68.212 09 (%) 51.489 09 (%) 49.709<br />
<strong>Bolsa</strong> <strong>de</strong> <strong>Cereales</strong> y Productos <strong>de</strong> <strong>Bahía</strong> <strong>Blanca</strong><br />
Dirección <strong>de</strong> Estudios Económicos<br />
14<br />
vs.<br />
may-<br />
09 (%)<br />
Carnes Frescas 65.314 20.859 9 18.644 -14 15.131 -76 5.375 -346 5.305 -289<br />
Leches 56.447 12.862 -3 12.932 -16 12.879 -80 10.123 -21 7.651 -94<br />
Menu<strong>de</strong>ncias y<br />
Vísceras<br />
50.382 12.179 6 11.418 -30 8.045 -71 9.816 -12 8.924 -33<br />
Cueros y Pieles 43.741 8.257 8 8.100 33 9.408 21 9.625 57 8.351 17<br />
Harinas Animales 27.366 11.216 62 6.218 29 5.978 -19 1.958 -132 1.996 -188<br />
Otros Lácteos 26.971 5.771 -15 4.761 -20 5.604 -6 5.278 -16 5.557 -48<br />
Quesos 15.497 3.704 42 2.598 -15 3.354 -12 3.164 -15 2.677 -75<br />
Carnes Procesadas 11.553 2.746 39 2.014 -55 2.647 48 1.553 23 2.593 63<br />
Cortes Hilton 10.480 2.006 -72 1.601 -62 2.013 -14 1.461 -67 3.399 28<br />
Demás Comestibles 8.477 1.846 -59 1.597 -132 1.609 -128 1.700 -73 1.725 -115<br />
Grasas y Aceites 4.527 1.034 -84 1.220 -37 698 -109 750 -133 825 -84<br />
Alimentos p/Animales 4.050 1.289 84 1.139 87 725 58 444 31 453 4<br />
Opoterápicos 683 323 -40 142 -75 48 -269 94 93 76 95<br />
Extractos/Caldos/Sop 363 116 -120 23 -717 54 -304 103 -169 67 -97<br />
Demás Incomestibles 234<br />
- 66 -80 15 -1.000 44 -125 109 -46<br />
Fiambres/Chacin/Embu 14<br />
- 7 86 4 0 1 75 2 -100<br />
Lanas/Plumas/Pelos/C 4 4 25<br />
-<br />
-<br />
-<br />
-<br />
Totales parciales 326.103 84.212 72.479 68.212 51.489 49.709<br />
Var (%) año anterior -21 12 -11 -30 -31 -40