EL MENSUAL GANADERO - Bolsa de Cereales de Bahía Blanca
EL MENSUAL GANADERO - Bolsa de Cereales de Bahía Blanca
EL MENSUAL GANADERO - Bolsa de Cereales de Bahía Blanca

Create successful ePaper yourself
Turn your PDF publications into a flip-book with our unique Google optimized e-Paper software.
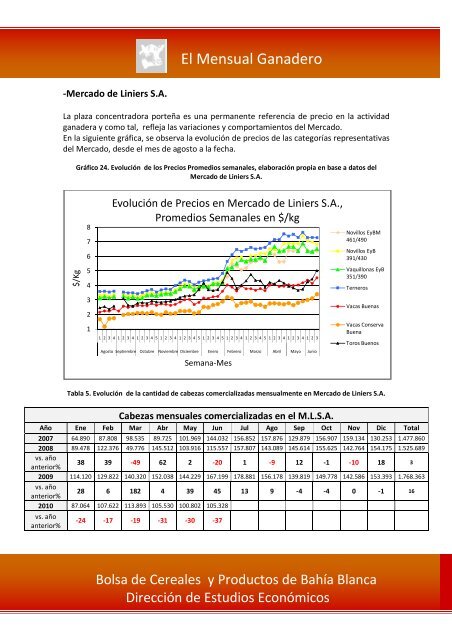
-Mercado <strong>de</strong> Liniers S.A.<br />
El Mensual Gana<strong>de</strong>ro<br />
La plaza concentradora porteña es una permanente referencia <strong>de</strong> precio en la actividad<br />
gana<strong>de</strong>ra y como tal, refleja las variaciones y comportamientos <strong>de</strong>l Mercado.<br />
En la siguiente gráfica, se observa la evolución <strong>de</strong> precios <strong>de</strong> las categorías representativas<br />
<strong>de</strong>l Mercado, <strong>de</strong>s<strong>de</strong> el mes <strong>de</strong> agosto a la fecha.<br />
$/Kg<br />
Gráfico 24. Evolución <strong>de</strong> los Precios Promedios semanales, elaboración propia en base a datos <strong>de</strong>l<br />
Mercado <strong>de</strong> Liniers S.A.<br />
8<br />
7<br />
6<br />
5<br />
4<br />
3<br />
2<br />
1<br />
Evolución <strong>de</strong> Precios en Mercado <strong>de</strong> Liniers S.A.,<br />
Promedios Semanales en $/kg<br />
1 2 3 4 1 2 3 4 1 2 3 4 5 1 2 3 4 1 2 3 4 5 1 2 3 4 5 1 2 3 4 1 2 3 4 5 1 2 3 4 1 2 3 4 1 2 3<br />
Agosto Septiembre Octubre Noviembre Diciembre Enero Febrero Marzo Abril Mayo Junio<br />
Semana-Mes<br />
Novillos EyBM<br />
461/490<br />
Novillos EyB<br />
391/430<br />
Vaquillonas EyB<br />
351/390<br />
Terneros<br />
Vacas Buenas<br />
Vacas Conserva<br />
Buena<br />
Toros Buenos<br />
Tabla 5. Evolución <strong>de</strong> la cantidad <strong>de</strong> cabezas comercializadas mensualmente en Mercado <strong>de</strong> Liniers S.A.<br />
Cabezas mensuales comercializadas en el M.L.S.A.<br />
Año Ene Feb Mar Abr May Jun Jul Ago Sep Oct Nov Dic Total<br />
2007 64.890 87.808 98.535 89.725 101.969 144.032 156.852 157.876 129.879 156.907 159.134 130.253 1.477.860<br />
2008 89.478 122.376 49.776 145.512 103.916 115.557 157.807 143.089 145.614 155.625 142.764 154.175 1.525.689<br />
vs. año<br />
anterior%<br />
38 39 -49 62 2 -20 1 -9 12 -1 -10 18 3<br />
2009 114.120 129.822 140.320 152.038 144.229 167.199 178.881 156.178 139.819 149.778 142.586 153.393 1.768.363<br />
vs. año<br />
anterior%<br />
28 6 182 4 39 45 13 9 -4 -4 0 -1 16<br />
2010 87.064 107.622 113.893 105.530 100.802 105.328<br />
vs. año<br />
anterior%<br />
-24 -17 -19 -31 -30 -37<br />
<strong>Bolsa</strong> <strong>de</strong> <strong>Cereales</strong> y Productos <strong>de</strong> <strong>Bahía</strong> <strong>Blanca</strong><br />
Dirección <strong>de</strong> Estudios Económicos<br />
32