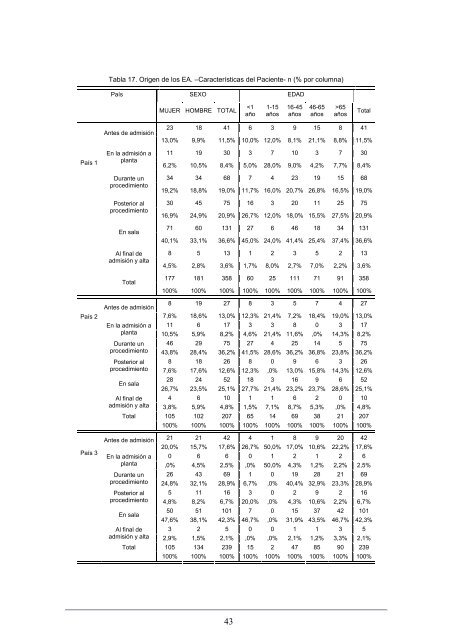
Antes <strong>de</strong> 24 12 0 5 1 42 31 8 39 admisión 18,5% 18,8% ,0% 29,4% 4,2% 17,6% 17,3% 26,7% 18,7% En la admisión 2 1 0 1 2 6 6 0 6 a planta 1,5% 1,6% ,0% 5,9% 8,3% 2,5% 3,4% ,0% 2,9% Durante un 25 28 4 1 11 69 51 10 61 procedimi<strong>en</strong>to 19,2% 43,8% 100% 5,9% 45,8% 28,9% 28,5% 33,3% 29,2% País Posterior al 3 6 0 3 4 16 11 4 15 3 procedimi<strong>en</strong>to 2,3% 9,4% ,0% 17,6% 16,7% 6,7% 6,1% 13,3% 7,2% En sala 72 16 0 7 6 101 77 8 85 55,4% 25,0% ,0% 41,2% 25,0% 42,3% 43,0% 26,7% 40,7% Al final <strong>de</strong> 4 1 0 0 0 5 3 0 3 admisión y alta 3,1% 1,6% ,0% ,0% ,0% 2,1% 1,7% ,0% 1,4% Total 130 64 4 17 24 239 179 30 209 100% 100% 100% 100% 100% 100% 100% 100% 100% Antes <strong>de</strong> 6 5 1 4 0 16 11 3 14 admisión 6,5% 6,6% 7,7% 28,6% ,0% 8,0% 7,9% 5,9% 7,3% En la admisión 1 0 1 0 0 2 2 0 2 a planta 1,1% ,0% 7,7% ,0% ,0% 1,0% 1,4% ,0% 1,0% Durante un 15 18 10 3 3 49 34 14 48 procedimi<strong>en</strong>to 16,3% 23,7% 76,9% 21,4% 60,0% 24,5% 24,3% 27,5% 25,1% País Posterior al 11 10 0 1 0 22 13 8 21 4 procedimi<strong>en</strong>to 12,0% 13,2% ,0% 7,1% ,0% 11,0% 9,3% 15,7% 11,0% En sala 55 38 1 6 2 102 72 25 97 59,8% 50,0% 7,7% 42,9% 40,0% 51,0% 51,4% 49,0% 50,8% Al final <strong>de</strong> 4 5 0 0 0 9 8 1 9 admisión y alta 4,3% 6,6% ,0% ,0% ,0% 4,5% 5,7% 2,0% 4,7% Total 92 76 13 14 5 200 140 51 191 100% 100% 100% 100% 100% 100% 100% 100% 100% Antes <strong>de</strong> 11 3 0 3 1 18 12 6 18 admisión 10,3% 3,6% ,0% 9,1% 3,1% 5,8% 4,8% 10,3% 5,8% En la admisión 7 5 0 1 0 13 9 4 13 a planta 6,5% 6,0% ,0% 3,0% ,0% 4,2% 3,6% 6,9% 4,2% Durante un 20 29 17 3 3 72 48 24 72 procedimi<strong>en</strong>to 18,7% 34,5% 30,9% 9,1% 9,4% 23,2% 19,2% 41,4% 23,4% País Posterior al 6 10 0 5 9 30 25 5 30 5 procedimi<strong>en</strong>to 5,6% 11,9% ,0% 15,2% 28,1% 9,6% 10,0% 8,6% 9,7% En sala 55 36 38 20 19 168 147 19 166 51,4% 42,9% 69,1% 60,6% 59,4% 54,0% 58,8% 32,8% 53,9% Al final <strong>de</strong> 8 1 0 1 0 10 9 0 9 admisión y alta 7,5% 1,2% ,0% 3,0% ,0% 3,2% 3,6% ,0% 2,9% Total 107 84 55 33 32 311 250 58 308 100% 100% 100% 100% 100% 100% 100% 100% 100% No existieron gran<strong>de</strong>s difer<strong>en</strong>cias <strong>en</strong> el mom<strong>en</strong>to <strong>de</strong> orig<strong>en</strong> <strong>de</strong>l EA por sexos (tabla 17), salvo <strong>en</strong> el país 2, don<strong>de</strong> el 18,6% <strong>de</strong> los EA i<strong>de</strong>ntificados <strong>en</strong> hombres ocurrió antes <strong>de</strong> la admisión, mi<strong>en</strong>tras que sólo el 7,6% <strong>de</strong> los i<strong>de</strong>ntificados <strong>en</strong> mujeres ocurrió <strong>en</strong> ese periodo. En relación con la edad, los paci<strong>en</strong>tes m<strong>en</strong>ores <strong>de</strong> 15 años sufrieron muchos EA <strong>en</strong> este periodo o durante la admisión <strong>en</strong> planta. 42
País 1 Tabla 17. Orig<strong>en</strong> <strong>de</strong> los EA. –Características <strong>de</strong>l Paci<strong>en</strong>te- n (% por columna) País SEXO EDAD Antes <strong>de</strong> admisión MUJER HOMBRE TOTAL 65 años Total 23 18 41 6 3 9 15 8 41 13,0% 9,9% 11,5% 10,0% 12,0% 8,1% 21,1% 8,8% 11,5% En la admisión a 11 19 30 3 7 10 3 7 30 planta 6,2% 10,5% 8,4% 5,0% 28,0% 9,0% 4,2% 7,7% 8,4% Durante un procedimi<strong>en</strong>to Posterior al procedimi<strong>en</strong>to En sala Al final <strong>de</strong> admisión y alta Total Antes <strong>de</strong> admisión 34 34 68 7 4 23 19 15 68 19,2% 18,8% 19,0% 11,7% 16,0% 20,7% 26,8% 16,5% 19,0% 30 45 75 16 3 20 11 25 75 16,9% 24,9% 20,9% 26,7% 12,0% 18,0% 15,5% 27,5% 20,9% 71 60 131 27 6 46 18 34 131 40,1% 33,1% 36,6% 45,0% 24,0% 41,4% 25,4% 37,4% 36,6% 8 5 13 1 2 3 5 2 13 4,5% 2,8% 3,6% 1,7% 8,0% 2,7% 7,0% 2,2% 3,6% 177 181 358 60 25 111 71 91 358 100% 100% 100% 100% 100% 100% 100% 100% 100% 8 19 27 8 3 5 7 4 27 País 2 7,6% 18,6% 13,0% 12,3% 21,4% 7,2% 18,4% 19,0% 13,0% País 3 En la admisión a 11 6 17 3 3 8 0 3 17 planta 10,5% 5,9% 8,2% 4,6% 21,4% 11,6% ,0% 14,3% 8,2% Durante un 46 29 75 27 4 25 14 5 75 procedimi<strong>en</strong>to 43,8% 28,4% 36,2% 41,5% 28,6% 36,2% 36,8% 23,8% 36,2% Posterior al 8 18 26 8 0 9 6 3 26 procedimi<strong>en</strong>to 7,6% 17,6% 12,6% 12,3% ,0% 13,0% 15,8% 14,3% 12,6% En sala 28 24 52 18 3 16 9 6 52 26,7% 23,5% 25,1% 27,7% 21,4% 23,2% 23,7% 28,6% 25,1% Al final <strong>de</strong> 4 6 10 1 1 6 2 0 10 admisión y alta 3,8% 5,9% 4,8% 1,5% 7,1% 8,7% 5,3% ,0% 4,8% Total 105 102 207 65 14 69 38 21 207 100% 100% 100% 100% 100% 100% 100% 100% 100% Antes <strong>de</strong> admisión 21 21 42 4 1 8 9 20 42 20,0% 15,7% 17,6% 26,7% 50,0% 17,0% 10,6% 22,2% 17,6% En la admisión a 0 6 6 0 1 2 1 2 6 planta ,0% 4,5% 2,5% ,0% 50,0% 4,3% 1,2% 2,2% 2,5% Durante un 26 43 69 1 0 19 28 21 69 procedimi<strong>en</strong>to 24,8% 32,1% 28,9% 6,7% ,0% 40,4% 32,9% 23,3% 28,9% Posterior al 5 11 16 3 0 2 9 2 16 procedimi<strong>en</strong>to 4,8% 8,2% 6,7% 20,0% ,0% 4,3% 10,6% 2,2% 6,7% En sala 50 51 101 7 0 15 37 42 101 47,6% 38,1% 42,3% 46,7% ,0% 31,9% 43,5% 46,7% 42,3% Al final <strong>de</strong> 3 2 5 0 0 1 1 3 5 admisión y alta 2,9% 1,5% 2,1% ,0% ,0% 2,1% 1,2% 3,3% 2,1% Total 105 134 239 15 2 47 85 90 239 100% 100% 100% 100% 100% 100% 100% 100% 100% 43
- Page 1 and 2: ESTUDIO IBEAS: PREVALENCIA DE EFECT
- Page 3: ESTUDIO IBEAS: PREVALENCIA DE EFECT
- Page 6 and 7: 1.- Antecedentes y justificación d
- Page 8 and 9: difíciles de identificar, sobre to
- Page 10 and 11: investigadores no preguntaban nada
- Page 12: 40% de casos detectados). Un estudi
- Page 15 and 16: Basándose en los antecedentes expu
- Page 17 and 18: Diseño Estudio observacional anal
- Page 19 and 20: cribado positivo), un médico entre
- Page 21 and 22: Ligadas a la enfermedad y/o procedi
- Page 23 and 24: Cronograma El cronograma inicial pr
- Page 25 and 26: Adaptación de los formularios Dura
- Page 28 and 29: 5.- Resultados del estudio de preva
- Page 30 and 31: Tabla 2. Indicadores sociodemográf
- Page 32 and 33: Considerando la estancia del pacien
- Page 34 and 35: inesperado”, que sólo aparece en
- Page 36 and 37: 16% 14% 12% 10% 8% 6% 14,5% 13,1% 1
- Page 38 and 39: Como se muestra en la tabla 10, los
- Page 40 and 41: 5.- Prevalencia y análisis multiva
- Page 44 and 45: País 4 País 5 Antes de admisión
- Page 46 and 47: País 2 País 3 País 4 País 5 Cui
- Page 48 and 49: Pendiente de especificar Total 33,3
- Page 50 and 51: 1,1% ,0% ,0% ,0% ,3% ,4% Cefalea po
- Page 52 and 53: Leve o ninguna incapacidad Tabla 23
- Page 54 and 55: Tabla 26. Gravedad de los EA -carac
- Page 56 and 57: Es esperable además encontrar EA m
- Page 58 and 59: Tabla 30. Resultados derivados de l
- Page 60 and 61: En general, alrededor de un 60% de
- Page 62 and 63: Esta valoración debería hacerse d
- Page 64 and 65: Al observar la proporción de EA ev
- Page 66: elacionada con la evitabilidad de l
- Page 69 and 70: País 1 País 2 País 3 País 4 Pa
- Page 71 and 72: En cuanto a los factores de riesgo
- Page 73 and 74: 3.- Incidencia por países La incid
- Page 75 and 76: Al explorar este punto, observamos
- Page 77 and 78: Tabla 48. Incidencia de pacientes c
- Page 79 and 80: 6.- Origen y localización de los E
- Page 81 and 82: mujeres más con los procedimientos
- Page 83 and 84: 8.- Impacto de los EA Determinar el
- Page 85 and 86: Sin embargo, al igual que en el est
- Page 87 and 88: Tabla 64. Resultados derivados de l
- Page 89 and 90: que ocurría en el estudio de preva
- Page 92 and 93:
92 7.- Discusión
- Page 94 and 95:
2.- Principales resultados del estu
- Page 96 and 97:
Incidencia: Se considera EA inciden
- Page 98 and 99:
Comparación de ambos métodos Al c
- Page 100 and 101:
Esta diferencia puede deberse a una
- Page 102 and 103:
se ha utilizado tradicionalmente en
- Page 104 and 105:
104 8.- Aplicabilidad práctica
- Page 106 and 107:
106 Anexo 1: Guía de cribado
- Page 108 and 109:
PROYECTO IDEA Identificación de Ef
- Page 110 and 111:
Anexo 2: Cuestionario modular para
- Page 112 and 113:
Módulo A: INFORMACIÓN DEL PACIENT
- Page 114 and 115:
estancia en el hospital (o readmisi
- Page 116 and 117:
Especifique las circunstancias rela
- Page 118 and 119:
B3 TRATAMIENTO ADICIONAL COMO RESUL
- Page 120 and 121:
C1 EA RELACIONADO CON LOS CUIDADOS
- Page 122 and 123:
C3 PROBLEMA PRINCIPAL DURANTE LA AS
- Page 124 and 125:
C5 FALLO EN EL ASESORAMIENTO ADECUA
- Page 126 and 127:
D2 EA POR FALLO EN LA VALORACIÓN G
- Page 128 and 129:
D3. (Cont.) ¿En qué aspectos fue
- Page 130 and 131:
D4. (Cont.) ¿Cómo contribuyeron e
- Page 132 and 133:
D5. (Cont.) ¿Cuánto fue el tiempo
- Page 134 and 135:
D6. (Cont.) ¿Podría un médico, u
- Page 136 and 137:
MÓDULO E: FACTORES CAUSALES Y CONT
- Page 138 and 139:
Anexo 3: Definiciones y acuerdos de
- Page 140 and 141:
Glosario Servicio: Debido a que muc
- Page 142 and 143:
10.- Déficit neurológico nuevo en
- Page 144 and 145:
Consensos sobre EA establecidos a p
- Page 146 and 147:
Anexo 4: Profesionales que han cola
- Page 148 and 149:
COORDINADORES DE LOS CENTROS SANITA
- Page 150 and 151:
COLABORADORES DE LOS CENTROS SANITA
- Page 152 and 153:
Colombia Colombia Colombia Colombia
- Page 154 and 155:
México México México México Mé
- Page 156 and 157:
México México México México Mé
- Page 158 and 159:
México México México México Mé
- Page 160 and 161:
Perú Perú Perú Perú Perú Perú
- Page 162 and 163:
REFERENCIAS 1 Aranaz JM, Aibar C, G
- Page 164:
34 Herrera-Kiengelher L, Chi-Lem G,