Las costas mexicanas y su crecimiento urbano - Instituto de GeografÃa
Las costas mexicanas y su crecimiento urbano - Instituto de GeografÃa
Las costas mexicanas y su crecimiento urbano - Instituto de GeografÃa

You also want an ePaper? Increase the reach of your titles
YUMPU automatically turns print PDFs into web optimized ePapers that Google loves.
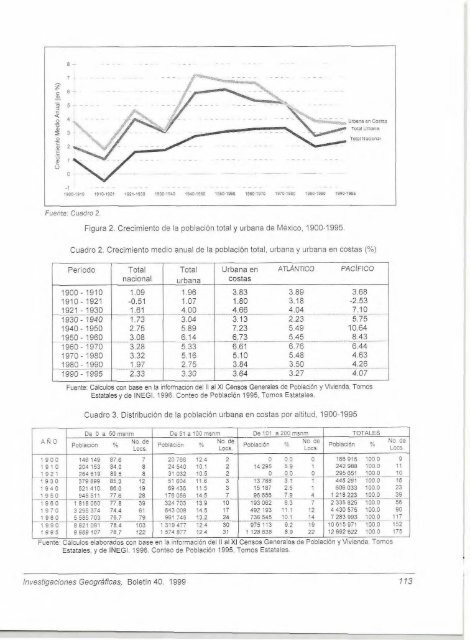
Fuente Cuadro 2<br />
Figura 2 Crecimiento <strong>de</strong> la poblactón total y urbana <strong>de</strong> México, 1900-1995<br />
Cuadro 2. Crecimiento medio anual <strong>de</strong> la población total, urbana y urbana en <strong>costas</strong> (%)<br />
Periodo Total Total Urbana en .4llAN7lCO VACiFiCO<br />
nacional urbana <strong>costas</strong><br />
1900- 1910 1 .O9 1.96 3.83 3.89 3.68<br />
1910 - 1921 -0.51 1 .O7 1 .80 3.18 -2.53<br />
1.61<br />
- 4.04 7.10<br />
1930 - 1940 1.73 3.04 3.13 2.23 5.75<br />
1940 1950 2.75 5.89 7.23 5.49 10.64<br />
1950 - 1960 3.08 4 ......................... 6.73 "S<br />
....<br />
. . 5.45 .... 8.43 .<br />
1960- 1970 3.28 5.33 6.61 6.76 6.44<br />
1970 1980 3.32 5.16 5.10 5.48 4.63<br />
1980 ~ - -" 1990 1.97 .. 2.75 . ..-. ................ 3.84 - 3.50 4.26 .<br />
1990 - 1995 2.33 3.30 3.64 3.27 4.07<br />
1921-1930 ................. 4.00 . 4.66<br />
Fuente: Cálculos con base en h iniorrnacjón <strong>de</strong>l II al XI Censos Generaks <strong>de</strong> Poblauón y V~ienda. Tomos<br />
Estatalesy <strong>de</strong> INEGI. 1996. Conteo <strong>de</strong> Poblacion 1995, Tomos Estatales.<br />
Cuadro 3 Distnbucion <strong>de</strong> la población urbana en <strong>costas</strong> por alttt~a, 1900-1995<br />
A N<br />
De O a 50 mmm De 51 al00 msnm De 101 a 200 msnm TaTALES<br />
NO. <strong>de</strong><br />
Población % Loa, PoblacMn % Pobiación % Pabladh LOCS.<br />
1900 146 149 87.6 7 20766 12.4 2 O 0.0 O 166915 100.0 9<br />
1910 204 153 84.0 8 24 540 10.1 2 14295 5.9 1 2421188 1000 11<br />
1921 ZE4 El? ..,..-..$@:S 8 31 0 3 2 . g , P - O ....... *. 265651 ...................... lUO.0 10<br />
1 93 O 379898 85.3 12 51604 11.6 3 13788 3.1 1 445291 1W.O í6<br />
1940 521410 86.0 19 69436 11.5 3 15 187 2.5, 1 606 033 1M)O 23<br />
1950 945511 77.6 28 1 7 6 6 s L .<br />
1960 1818060 77.8 39 324703 13.9 10 193062 8.5 7 2335825 100.0 56<br />
1970 3295 374 74.4 61 643008 14.5 17 492 193 11.1 12 4430 575 1000 90<br />
1 9 8 0 558503 ... E7 .... 0.._217452 E<br />
96656 7.8 4 . !.?O213 ... tOOO 39<br />
736 545 10.1 !e -G83.?93.BE . X-.<br />
1990 8821 081 78.4 103 1319477 12.4 30 975113 9.2 19 10615 a71 lüO.0 152<br />
1995 SS89107 78.7 122 1574877 12.4 al 1 128638 8.9 22 12692622 IOOO 175<br />
Fuente: Cálculos elaborados con base en la infomción <strong>de</strong>l II al XI Censos Generales <strong>de</strong> Población y Vivienda. Tornos<br />
Estatales, y <strong>de</strong> INEGI. 1996. Conteo <strong>de</strong> Pobladón 1995. Tomos Estataes.<br />
Investigaciones Geográficas, Boletín 40, 1999