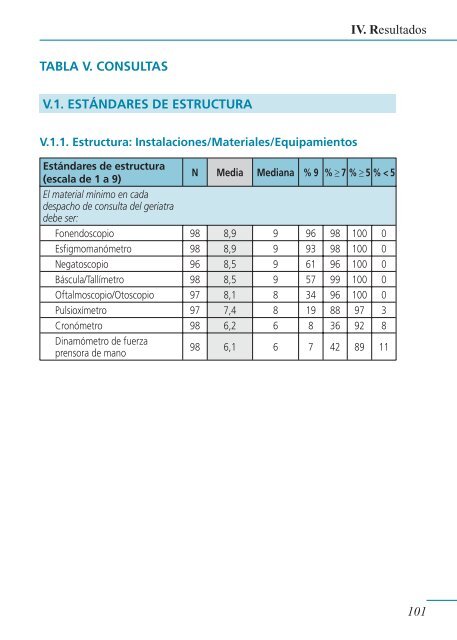
IV. ResultadosTABLA V. CONSULTASV.1. ESTÁNDARES DE ESTRUCTURAV.1.1. Estructura: Instalaciones/Materiales/Equipami<strong>en</strong>tosEstándares <strong>de</strong> estructura(escala <strong>de</strong> 1 a 9)N Media Mediana % 9 % ≥ 7 % ≥ 5 % < 5El material mínimo <strong>en</strong> cada<strong>de</strong>spacho <strong>de</strong> consulta <strong>de</strong>l geriatra<strong>de</strong>be ser:Fon<strong>en</strong>doscopio 98 8,9 9 96 98 100 0Esfigmomanómetro 98 8,9 9 93 98 100 0Negatoscopio 96 8,5 9 61 96 100 0Báscula/Tallímetro 98 8,5 9 57 99 100 0Oftalmoscopio/Otoscopio 97 8,1 8 34 96 100 0Pulsioxímetro 97 7,4 8 19 88 97 3Cronómetro 98 6,2 6 8 36 92 8Dinamómetro <strong>de</strong> fuerzapr<strong>en</strong>sora <strong>de</strong> mano98 6,1 6 7 42 89 11101
Estándares <strong>de</strong> <strong>Calidad</strong> <strong>en</strong> GeriatríaTABLA V. CONSULTAS (continuación)IV.2 ESTÁNDARES DE PROCESOV.2.1. Proceso: Estándares <strong>de</strong> tiemposEstándares <strong>de</strong> tiempos(cuantificados)El tiempo medio <strong>de</strong> duración(expresado <strong>en</strong> minutos) <strong>de</strong> laprimera consulta al geriatra <strong>de</strong> unpaci<strong>en</strong>te anciano <strong>de</strong>be ser:El tiempo medio <strong>de</strong> duración(expresado <strong>en</strong> minutos) <strong>de</strong> laconsulta sucesiva al geriatra <strong>de</strong> unpaci<strong>en</strong>te anciano <strong>de</strong>be ser:El tiempo máximo <strong>de</strong> espera(expresado <strong>en</strong> días) para laprimera consulta ordinaria algeriatra <strong>de</strong>be ser:El tiempo máximo <strong>de</strong> espera(expresado <strong>en</strong> días) para laprimera consulta prefer<strong>en</strong>te algeriatra <strong>de</strong>be ser:El número máximo <strong>de</strong> horas <strong>de</strong>consulta <strong>de</strong> un geriatra al día no<strong>de</strong>be sobrepasar:La relación promedio <strong>de</strong>seable <strong>de</strong>consultas sucesivas por cada visitanueva (<strong>en</strong> un periodo <strong>de</strong> un año)<strong>de</strong>be ser:El tiempo máximo (expresado<strong>en</strong> días) para revisar el plan<strong>de</strong> at<strong>en</strong>ción tras un cambioimportante <strong>en</strong> el estado <strong>de</strong> salud<strong>de</strong>l anciano <strong>de</strong>be ser:N Media Mediana P25 P75 DE CV95 54,3 60 45 60 9,9 82,995 23,5 20 20 30 5,4 85,294 23,2 21 15 30 9,9 64,794 8,1 7 7 10 3,1 86,195 4,7 5 4 5 1,0 84,391 3,0 3 3 3 0,7 99,892 7,8 7 5 10 3,8 64,5P25 = perc<strong>en</strong>til 25; P75 = perc<strong>en</strong>til 75; DE = <strong>de</strong>sviación estándar; CV = coefici<strong>en</strong>te <strong>de</strong> variación.102