Informe de Producción Agropecuaria Acumulado a Octubre ... - magfor
Informe de Producción Agropecuaria Acumulado a Octubre ... - magfor
Informe de Producción Agropecuaria Acumulado a Octubre ... - magfor
- No tags were found...

You also want an ePaper? Increase the reach of your titles
YUMPU automatically turns print PDFs into web optimized ePapers that Google loves.
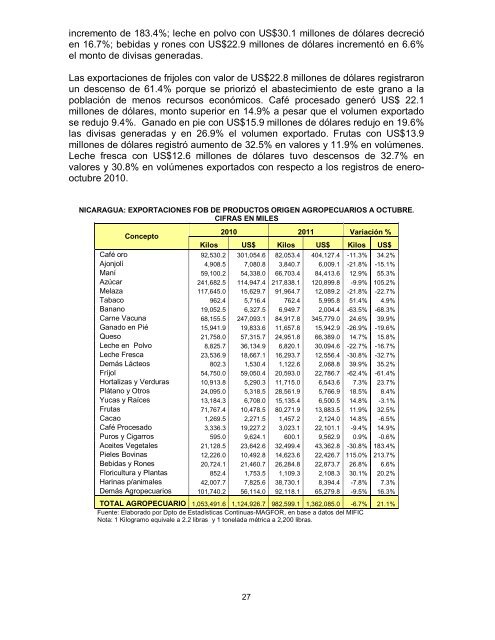
incremento <strong>de</strong> 183.4%; leche en polvo con US$30.1 millones <strong>de</strong> dólares <strong>de</strong>crecióen 16.7%; bebidas y rones con US$22.9 millones <strong>de</strong> dólares incrementó en 6.6%el monto <strong>de</strong> divisas generadas.Las exportaciones <strong>de</strong> frijoles con valor <strong>de</strong> US$22.8 millones <strong>de</strong> dólares registraronun <strong>de</strong>scenso <strong>de</strong> 61.4% porque se priorizó el abastecimiento <strong>de</strong> este grano a lapoblación <strong>de</strong> menos recursos económicos. Café procesado generó US$ 22.1millones <strong>de</strong> dólares, monto superior en 14.9% a pesar que el volumen exportadose redujo 9.4%. Ganado en pie con US$15.9 millones <strong>de</strong> dólares redujo en 19.6%las divisas generadas y en 26.9% el volumen exportado. Frutas con US$13.9millones <strong>de</strong> dólares registró aumento <strong>de</strong> 32.5% en valores y 11.9% en volúmenes.Leche fresca con US$12.6 millones <strong>de</strong> dólares tuvo <strong>de</strong>scensos <strong>de</strong> 32.7% envalores y 30.8% en volúmenes exportados con respecto a los registros <strong>de</strong> enerooctubre2010.NICARAGUA: EXPORTACIONES FOB DE PRODUCTOS ORIGEN AGROPECUARIOS A OCTUBRE.CIFRAS EN MILESConcepto2010 2011 Variación %Kilos US$ Kilos US$ Kilos US$Café oro 92,530.2 301,054.6 82,053.4 404,127.4 -11.3% 34.2%Ajonjolí 4,908.5 7,080.8 3,840.7 6,009.1 -21.8% -15.1%Maní 59,100.2 54,338.0 66,703.4 84,413.6 12.9% 55.3%Azúcar 241,682.5 114,947.4 217,838.1 120,899.8 -9.9% 105.2%Melaza 117,645.0 15,629.7 91,964.7 12,089.2 -21.8% -22.7%Tabaco 962.4 5,716.4 762.4 5,995.8 51.4% 4.9%Banano 19,052.5 6,327.5 6,949.7 2,004.4 -63.5% -68.3%Carne Vacuna 68,155.5 247,093.1 84,917.8 345,779.0 24.6% 39.9%Ganado en Pié 15,941.9 19,833.6 11,657.8 15,942.9 -26.9% -19.6%Queso 21,758.0 57,315.7 24,951.8 66,389.0 14.7% 15.8%Leche en Polvo 8,825.7 36,134.9 6,820.1 30,094.6 -22.7% -16.7%Leche Fresca 23,536.9 18,667.1 16,293.7 12,556.4 -30.8% -32.7%Demás Lácteos 802.3 1,530.4 1,122.6 2,068.8 39.9% 35.2%Fríjol 54,750.0 59,050.4 20,593.0 22,786.7 -62.4% -61.4%Hortalizas y Verduras 10,913.8 5,290.3 11,715.0 6,543.6 7.3% 23.7%Plátano y Otros 24,095.0 5,318.5 28,561.9 5,766.9 18.5% 8.4%Yucas y Raíces 13,184.3 6,708.0 15,135.4 6,500.5 14.8% -3.1%Frutas 71,767.4 10,478.5 80,271.9 13,883.5 11.9% 32.5%Cacao 1,269.5 2,271.5 1,457.2 2,124.0 14.8% -6.5%Café Procesado 3,336.3 19,227.2 3,023.1 22,101.1 -9.4% 14.9%Puros y Cigarros 595.0 9,624.1 600.1 9,562.9 0.9% -0.6%Aceites Vegetales 21,128.5 23,642.6 32,499.4 43,362.8 -30.8% 183.4%Pieles Bovinas 12,226.0 10,492.8 14,623.6 22,426.7 115.0% 213.7%Bebidas y Rones 20,724.1 21,460.7 26,284.8 22,873.7 26.8% 6.6%Floricultura y Plantas 852.4 1,753.5 1,109.3 2,108.3 30.1% 20.2%Harinas p/animales 42,007.7 7,825.6 38,730.1 8,394.4 -7.8% 7.3%Demás Agropecuarios 101,740.2 56,114.0 92,118.1 65,279.8 -9.5% 16.3%TOTAL AGROPECUARIO 1,053,491.6 1,124,926.7 982,599.1 1,362,085.0 -6.7% 21.1%Fuente: Elaborado por Dpto <strong>de</strong> Estadísticas Continuas-MAGFOR, en base a datos <strong>de</strong>l MIFICNota: 1 Kilogramo equivale a 2.2 libras y 1 tonelada métrica a 2,200 libras.27