Pêche artisanale dans la lagune de Nador ... - Fao - Copemed
Pêche artisanale dans la lagune de Nador ... - Fao - Copemed
Pêche artisanale dans la lagune de Nador ... - Fao - Copemed

Create successful ePaper yourself
Turn your PDF publications into a flip-book with our unique Google optimized e-Paper software.
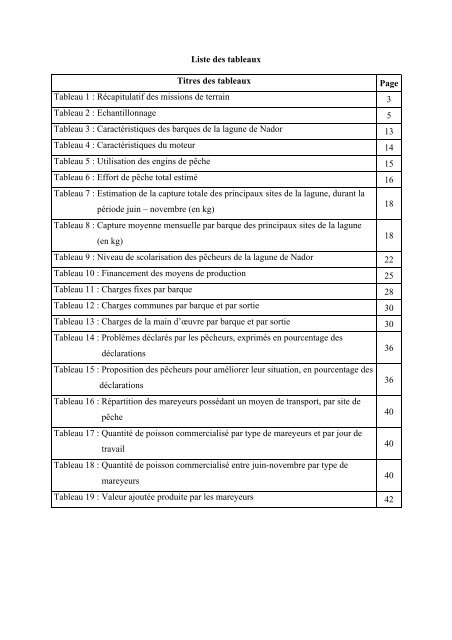
Liste <strong>de</strong>s tableaux<br />
Titres <strong>de</strong>s tableaux<br />
Page<br />
Tableau 1 : Récapitu<strong>la</strong>tif <strong>de</strong>s missions <strong>de</strong> terrain 3<br />
Tableau 2 : Echantillonnage 5<br />
Tableau 3 : Caractéristiques <strong>de</strong>s barques <strong>de</strong> <strong>la</strong> <strong>la</strong>gune <strong>de</strong> <strong>Nador</strong> 13<br />
Tableau 4 : Caractéristiques du moteur 14<br />
Tableau 5 : Utilisation <strong>de</strong>s engins <strong>de</strong> pêche 15<br />
Tableau 6 : Effort <strong>de</strong> pêche total estimé 16<br />
Tableau 7 : Estimation <strong>de</strong> <strong>la</strong> capture totale <strong>de</strong>s principaux sites <strong>de</strong> <strong>la</strong> <strong>la</strong>gune, durant <strong>la</strong><br />
pério<strong>de</strong> juin – novembre (en kg)<br />
Tableau 8 : Capture moyenne mensuelle par barque <strong>de</strong>s principaux sites <strong>de</strong> <strong>la</strong> <strong>la</strong>gune<br />
(en kg)<br />
18<br />
18<br />
Tableau 9 : Niveau <strong>de</strong> sco<strong>la</strong>risation <strong>de</strong>s pêcheurs <strong>de</strong> <strong>la</strong> <strong>la</strong>gune <strong>de</strong> <strong>Nador</strong> 22<br />
Tableau 10 : Financement <strong>de</strong>s moyens <strong>de</strong> production 25<br />
Tableau 11 : Charges fixes par barque 28<br />
Tableau 12 : Charges communes par barque et par sortie 30<br />
Tableau 13 : Charges <strong>de</strong> <strong>la</strong> main d’œuvre par barque et par sortie 30<br />
Tableau 14 : Problèmes déc<strong>la</strong>rés par les pêcheurs, exprimés en pourcentage <strong>de</strong>s<br />
déc<strong>la</strong>rations<br />
Tableau 15 : Proposition <strong>de</strong>s pêcheurs pour améliorer leur situation, en pourcentage <strong>de</strong>s<br />
déc<strong>la</strong>rations<br />
Tableau 16 : Répartition <strong>de</strong>s mareyeurs possédant un moyen <strong>de</strong> transport, par site <strong>de</strong><br />
pêche<br />
Tableau 17 : Quantité <strong>de</strong> poisson commercialisé par type <strong>de</strong> mareyeurs et par jour <strong>de</strong><br />
travail<br />
Tableau 18 : Quantité <strong>de</strong> poisson commercialisé entre juin-novembre par type <strong>de</strong><br />
mareyeurs<br />
36<br />
36<br />
40<br />
40<br />
40<br />
Tableau 19 : Valeur ajoutée produite par les mareyeurs 42