La 3e Enquête épidémiologique - Conseil général du Val-de-Marne
La 3e Enquête épidémiologique - Conseil général du Val-de-Marne
La 3e Enquête épidémiologique - Conseil général du Val-de-Marne

Create successful ePaper yourself
Turn your PDF publications into a flip-book with our unique Google optimized e-Paper software.
Enquête Bucco-Dentaire 2000-2001<br />
Enfants <strong>de</strong> 6 ans<br />
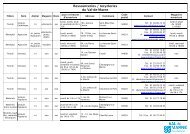
c) Comparaison selon le lieu <strong>de</strong> naissance <strong>de</strong>s parents <strong>de</strong>s échantillons<br />
d’enfants examinés et non examinés<br />
Enfants examinés<br />
Enfants non examinés<br />
Lieu naissance parents Nombre Pourcentage Nombre Pourcentage<br />
France 389 60.9 36 69.2<br />
Afrique <strong>du</strong> Nord 77 12.1 7 13.5<br />
Europe <strong>du</strong> Sud 45 7.0 6 11.5<br />
Sud Est Asiatique 22 3.4 1 1.9<br />
Autres pays d’Afrique 52 8.1 1 1.9<br />
Autres nationalités 54 8.5 1 1.9<br />
Total <strong>de</strong>s données disponibles 639 100.0 52 100.0<br />
Indéterminés 586 188<br />
Les distributions, selon le lieu <strong>de</strong> naissance <strong>de</strong>s parents, n’ont pas différé significativement chez<br />
les enfants examinés et non examinés<br />
d) Comparaison selon la catégorie socioprofessionnelle <strong>du</strong> père <strong>de</strong>s<br />
échantillons d’enfants examinés et non examinés<br />
Enfants examinés<br />
Enfants non examinés<br />
C.S.P. DU PERE Nombre Pourcentage Nombre Pourcentage<br />
Artisan commerçant 70 8.0 8 8.2<br />
Cadre prof. intellectuelle sup.. 160 18.4 24 24.5<br />
Prof. intermédiaire 176 20.2 15 15.3<br />
Employé 167 19.1 25 25.5<br />
Ouvrier 299 34.3 26 26.5<br />
Total <strong>de</strong>s données disponibles 872 100.0 98 100.0<br />
Indéterminés 353 142<br />
Les distributions, selon la catégorie socioprofessionnelle <strong>du</strong> père, n’ont pas différé<br />
significativement chez les enfants examinés et non examinés<br />
e) Comparaison selon la catégorie socioprofessionnelle <strong>de</strong> la mère <strong>de</strong>s<br />
échantillons d’enfants examinés et non examinés<br />
Enfants examinés<br />
Enfants non examinés<br />
C.S.P. DE LA MERE Nombre Pourcentage Nombre Pourcentage<br />
Artisan commerçant 21 2.3 0 0.0<br />
Cadre prof. intellectuelle sup.. 97 10.6 13 12.5<br />
Prof. intermédiaire 185 20.2 15 14.4<br />
Employée 392 42.8 47 45.2<br />
Ouvrier 27 3.0 1 1.0<br />
Sans profession 193 21.1 28 26.9<br />
Total <strong>de</strong>s données disponibles 915 100.0 104 100.0<br />
Indéterminés 310 136<br />
Les distributions, selon la catégorie socioprofessionnelle <strong>de</strong> la mère, n’ont pas différé<br />
significativement chez les enfants examinés et non examinés.<br />
<strong>Conseil</strong> Général <strong>du</strong> <strong>Val</strong>-<strong>de</strong>-<strong>Marne</strong> - 16 -