

Etude de la couronne solaire en 3D et de son évolution avec SOHO ...
Etude de la couronne solaire en 3D et de son évolution avec SOHO ...
Etude de la couronne solaire en 3D et de son évolution avec SOHO ...

Create successful ePaper yourself
Turn your PDF publications into a flip-book with our unique Google optimized e-Paper software.
tel-00089354, version 1 - 17 Aug 2006<br />
856 ASCHWANDEN ET AL. Vol. 515<br />
NS [<strong>de</strong>g]<br />
-0.02<br />
-0.04<br />
-0.06<br />
-0.08<br />
-0.10<br />
-0.12<br />
-0.14<br />
-0.16<br />
960830 002014 UT: <strong>SOHO</strong>/EIT 171 A loops + MDI/Pot<strong>en</strong>tial field<br />
11<br />
10<br />
15<br />
12<br />
8<br />
14<br />
18<br />
11<br />
8<br />
9<br />
16<br />
6<br />
10<br />
17<br />
7<br />
19<br />
7<br />
19<br />
18<br />
17<br />
16<br />
15<br />
14<br />
1213<br />
9<br />
6<br />
54<br />
3 21<br />
4<br />
3<br />
-0.10 -0.08 -0.06 -0.04 -0.02<br />
EW [<strong>de</strong>g]<br />
0.00 0.02 0.04<br />
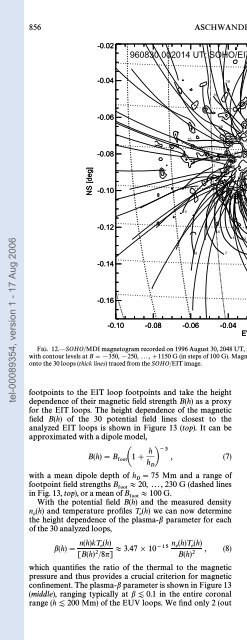
FIG. 12.È<strong>SOHO</strong>/MDI magn<strong>et</strong>ogram recor<strong>de</strong>d on 1996 August 30, 2048 UT, rotated to the time of the analyzed EIT image (1996 August 30, 0020:14 UT),<br />
with contour levels at B \[350, [250, ...,]1150 G (in steps of 100 G). Magn<strong>et</strong>ic Ðeld lines calcu<strong>la</strong>ted from a pot<strong>en</strong>tial Ðeld mo<strong>de</strong>l are over<strong>la</strong>id (thin lines)<br />
onto the 30 loops (thick lines) traced from the <strong>SOHO</strong>/EIT image.<br />
footpoints to the EIT loop footpoints and take the height<br />
<strong>de</strong>p<strong>en</strong><strong>de</strong>nce of their magn<strong>et</strong>ic Ðeld str<strong>en</strong>gth B(h) as a proxy<br />
for the EIT loops. The height <strong>de</strong>p<strong>en</strong><strong>de</strong>nce of the magn<strong>et</strong>ic<br />
Ðeld B(h) of the 30 pot<strong>en</strong>tial Ðeld lines closest to the<br />
analyzed EIT loops is shown in Figure 13 (top). It can be<br />
approximated with a dipole mo<strong>de</strong>l,<br />
A hB~3<br />
B(h) \ B 1 ] , (7)<br />
foot h<br />
D<br />
with a mean dipole <strong>de</strong>pth of h \ 75 Mm and a range of<br />
footpoint Ðeld str<strong>en</strong>gths B B<br />
D<br />
20, ...,230G(dashed lines<br />
in Fig. 13, top),orameanof<br />
foot<br />
B B 100 G.<br />
With the pot<strong>en</strong>tial Ðeld B(h)<br />
foot<br />
and the measured <strong>de</strong>nsity<br />
n (h) and temperature proÐles T (h) we can now <strong>de</strong>termine<br />
e e<br />
the height <strong>de</strong>p<strong>en</strong><strong>de</strong>nce of the p<strong>la</strong>sma-b param<strong>et</strong>er for each<br />
of the 30 analyzed loops,<br />
b(h) \ n(h)kT e (h)<br />
[B(h)2/8n] B 3.47 ] 10~15 n e (h)T e (h)<br />
, (8)<br />
B(h)2<br />
which quantiÐes the ratio of the thermal to the magn<strong>et</strong>ic<br />
pressure and thus provi<strong>de</strong>s a crucial criterion for magn<strong>et</strong>ic<br />
conÐnem<strong>en</strong>t. The p<strong>la</strong>sma-b param<strong>et</strong>er is shown in Figure 13<br />
(middle), ranging typically at b [ 0.1 in the <strong>en</strong>tire coronal<br />
range (h [ 200 Mm) of the EUV loops. We Ðnd only 2 (out<br />
5<br />
20<br />
22<br />
21<br />
20<br />
13<br />
2<br />
21<br />
22<br />
1<br />
28<br />
3029<br />
30<br />
24<br />
23<br />
27<br />
26<br />
29<br />
28<br />
26<br />
27<br />
of 30 loops) that exceed the critical limit of b º 1, possibly<br />
implying curr<strong>en</strong>ts and nonpot<strong>en</strong>tial magn<strong>et</strong>ic Ðelds along<br />
the loops. Gary & Alexan<strong>de</strong>r (1999) found such regimes<br />
with b Z 1 in the upper corona at h Z 0.2 R from analysis<br />
_<br />
of SXR loops, in contrast to the common belief that the<br />
coronal value is always b > 1 (Dulk & McLean 1978; Priest<br />
1981; Sakurai 1989; Gary 1990; McClymont, Jiao, & Mikic<br />
1997). Reliable measurem<strong>en</strong>ts of the p<strong>la</strong>sma-b param<strong>et</strong>er<br />
require fully resolved structures, such as single loops<br />
analyzed here (save for unknown Ðlling factors), whereas<br />
line-of-sight averaged <strong>de</strong>nsities are expected to un<strong>de</strong>restimate<br />
the <strong>de</strong>nsity in loop structures and thus are biased<br />
toward too low b values.<br />
A further p<strong>la</strong>sma param<strong>et</strong>er that is of interest for coronal<br />
loop dynamics is the Alfve n velocity, which can be computed<br />
along individual loops thanks to the knowledge of<br />
the magn<strong>et</strong>ic Ðeld B(h) and <strong>de</strong>nsity n (h),<br />
e<br />
v (h) \<br />
A B(h)<br />
B 2.18]1011<br />
J4nn (h)m<br />
i i<br />
B(h)<br />
cm s~1 . (9)<br />
Jn (h)<br />
e<br />
This quantity is shown in Figure 13 (bottom). The Alfve n<br />
velocity is found to be highest near the footpoints of the<br />
analyzed EUV loops, ranging from v (h \ 0) B 2000 to<br />
A<br />
6000 km s~1, and is dropping o† steadily with <strong>la</strong>rger height<br />
23<br />
24<br />
25<br />
25


