My ABDELHADI AIT SLIMANTRANSPORT COLLECTIF URBAIN AU MAROCEmail: sliman68@hotmail.com Analyse <strong>de</strong> <strong>la</strong> situation <strong>de</strong>s régies <strong>de</strong> transport 1970-2000BIBLIOGRAPHIE1. Ministère <strong>de</strong> l’intérieur, (2001), rapport sur le secteur <strong>de</strong>s transports <strong>urbain</strong>s -DRSC Février 2001.2. Ministère <strong>de</strong> finance, (2001), Situation du secteur <strong>de</strong>s transports publics <strong>urbain</strong>s 1995-2000, D.E.P.P, Rapport 2001.3. Direction <strong>de</strong> <strong>la</strong> Statistique, (2001), CERED, Projection <strong>de</strong> <strong>la</strong> popu<strong>la</strong>tion en 2001, base sur les résultats du recensement1994.4. Ministère <strong>de</strong> l’intérieur, (2000), <strong>la</strong> commun<strong>au</strong>té <strong>urbain</strong>e <strong>de</strong> Casab<strong>la</strong>nca, rése<strong>au</strong> <strong>de</strong> transport <strong>urbain</strong> en 2000.5. Direction <strong>de</strong> <strong>la</strong> Statistique, <strong>Maroc</strong> en chiffre 2000 (projection <strong>au</strong> 01.07.2000)6. Ministère <strong>de</strong> l’intérieur, (1997), secrétariat général, direction <strong>de</strong>s régies et services concè<strong>de</strong>s (D.R.S.C). Rapport Situationdu secteur <strong>de</strong>s transports publics <strong>urbain</strong>s 1991-1996, juin 997.7. METMED 3, (1995), Complémentarité <strong>de</strong> transport : Présentation et discussion situation <strong>de</strong> Casab<strong>la</strong>nca, juin-juillet 1995.8. Direction <strong>de</strong> <strong>la</strong> Statistique, Annuaire statistique du <strong>Maroc</strong> 19949. Ministère <strong>de</strong> l’intérieur, Direction <strong>de</strong>s régies et services concédés, « Cahier <strong>de</strong> charges type pour l'exploitation d'unservice <strong>de</strong> transport public », Rabat, 1994.10. Ministre <strong>de</strong> l’intérieur, Direction <strong>de</strong>s régies et services concédés, « Données sur les Régies : entre : 1976-1988 »,Rabat, 1992.11. Ministre <strong>de</strong> l’intérieur, Direction <strong>de</strong>s régies et services concédés, « Données sur les Régies : Effectifs, Parc, Recettes,Dépenses, Nombre <strong>de</strong> voyageurs, Investissements; entre : 1986 et 1991 », Rabat, 1992.12. Ministre <strong>de</strong> l’intérieur, Direction <strong>de</strong>s régies et services concédés, « Performances d'exploitation <strong>de</strong> <strong>la</strong> R.A.T.R. 1987-1992 », Rabat, 1992.13. Nasr Hajji, <strong>la</strong>rbi jaidi, et Meki Zouaoui, (1992), « prix et concurrence <strong>au</strong> <strong>Maroc</strong> », secteur <strong>de</strong>s pneumatiques, Ed. NajahEl Jadida, Casab<strong>la</strong>nca, 1992.14. Ministère <strong>de</strong> l’intérieur, R.A.T.R., « Lignes <strong>de</strong> RABAT-SALE situation en Janv.1991 », RATR, 1991.15. Ministère <strong>de</strong> l’intérieur, (1991), Rapport sur les lignes <strong>de</strong> <strong>la</strong> R.A.T.R., Janvier 199116. Ministre <strong>de</strong> <strong>la</strong> panification, Direction <strong>de</strong> statistique, « ménages, variables socio-démographique », Rabat, 1990.17. Ministre <strong>de</strong> l’intérieur, Direction <strong>de</strong>s régies et services concédés, « Les Régies Données 1990 », Rabat.18. Ministère <strong>de</strong> l’intérieur, Agence <strong>urbain</strong>e <strong>de</strong> Casab<strong>la</strong>nca, « Circu<strong>la</strong>tion, <strong>Transport</strong> en commun, perspectives duschéma directeur », Casab<strong>la</strong>nca, 1989.19. Ministre <strong>de</strong> p<strong>la</strong>n, délégation régionale du centre Nord Fès, « Enquête sur le transport <strong>urbain</strong> à Fès », Fès, 1987.20. Ministre <strong>de</strong> l’intérieur, « Bi<strong>la</strong>ns et réalisation, moyens mis en oeuvre, problèmes du secteur <strong>de</strong> transport <strong>urbain</strong>, mesures<strong>de</strong> redressement », Rabat, 1986.21. Ministère <strong>de</strong> l’intérieur, Divisions <strong>de</strong>s collectivités locales, services <strong>de</strong>s transports <strong>urbain</strong> « Etu<strong>de</strong> <strong>de</strong>s problèmes etperspectives <strong>de</strong> transport public <strong>urbain</strong> <strong>au</strong> <strong>Maroc</strong> », Rabat, 1979.22. Ministère <strong>de</strong> l’intérieur, « P<strong>la</strong>n quinquennal <strong>de</strong> transport 1978 - 1982, secteur <strong>de</strong>s transports publics <strong>urbain</strong>s », Rabat,1977.23. Ministère <strong>de</strong>s trav<strong>au</strong>x publics et <strong>de</strong>s communications, Direction <strong>de</strong>s routes, « P<strong>la</strong>n <strong>de</strong> circu<strong>la</strong>tion <strong>de</strong>Casab<strong>la</strong>nca », Rapport TRANS ROUTE, Août 1976.24. Ministère <strong>de</strong>s trav<strong>au</strong>x publics et <strong>de</strong>s communications, « Etu<strong>de</strong> du secteur <strong>de</strong>s transports, Etu<strong>de</strong> <strong>de</strong>s liaisons routièresCasab<strong>la</strong>nca_Rabat et Kenitra_Larache », Rapport préliminaire, Fév. 1971.25. REGIE AUTONOME DE TRANSPORT URBAIN DE CASABLANCA, R.A.T.C., « Budget <strong>de</strong> l'Exercice 1994,1988,1985,1986,1980 ».26. REGIE AUTONOME DE TRANSPORT URBAIN DE FÈS, R.A.T.F., « Comptes officiels, Exercice 1993,1992,1991,1990, 1988, ».27. REGIE AUTONOME DE TRANSPORT URBAIN DE MARRAKECH, R.A.T.MA., « Budget <strong>de</strong> l'Exercice1992, 1991, 1990 »28. REGIE AUTONOME DE TRANSPORT URBAIN DE MARRAKECH « Données <strong>de</strong> l'exploitation <strong>de</strong> 1987 à 1980 ».29. REGIE AUTONOME DE TRANSPORT URBAIN DE MEKNES, R.A.T.M., « Comptes officiels, Exercice 1993,89,1978, 1985, 1984, 1981, ».30. REGIE AUTONOME DE TRANSPORT URBAIN DE RABAT SALE, R.A.T.R., « Bi<strong>la</strong>n <strong>de</strong> l'Exercice1991,1990,1989,1988,1987,1985,1984,1983,1981 ».31. REGIE AUTONOME DE TRANSPORT URBAIN DE SAFI, R.A.T.S., « Bi<strong>la</strong>n <strong>de</strong> l'Exercice 1983,1982, ».32. REGIE AUTONOME DE TRANSPORT URBAIN DE AGADIR, R.A.T.AG, « Budget <strong>de</strong> l'exercice 1983 ».Site web:"Les transports <strong>collectif</strong>s terrestres <strong>de</strong> voyageurs en France", , www.transports.equipement.gouv.fr.06/08/2002.Christian PHILIP, Député du Rhône et Nico<strong>la</strong>s GAUTHIER, Direction <strong>de</strong>s <strong>Transport</strong>s Terrestres, "LeFinancement <strong>de</strong>s Dép<strong>la</strong>cements <strong>urbain</strong>s", http://www.equipement.gouv.fr, 9 décembre 2003.22
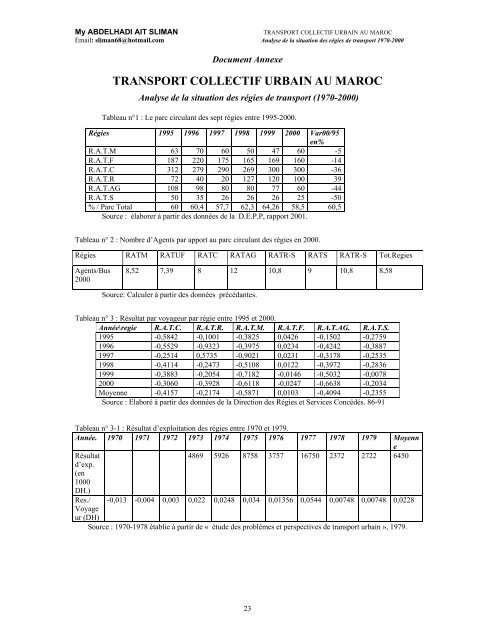
My ABDELHADI AIT SLIMANTRANSPORT COLLECTIF URBAIN AU MAROCEmail: sliman68@hotmail.com Analyse <strong>de</strong> <strong>la</strong> situation <strong>de</strong>s régies <strong>de</strong> transport 1970-2000Document AnnexeTRANSPORT COLLECTIF URBAIN AU MAROCAnalyse <strong>de</strong> <strong>la</strong> situation <strong>de</strong>s régies <strong>de</strong> transport (1970-2000)Table<strong>au</strong> n°1 : Le parc circu<strong>la</strong>nt <strong>de</strong>s sept régies entre 1995-2000.Régies 1995 1996 1997 1998 1999 2000 Var00/95en%R.A.T.M 63 70 60 50 47 60 -5R.A.T.F 187 220 175 165 169 160 -14R.A.T.C 312 279 290 269 300 300 -36R.A.T.R 72 40 20 127 120 100 39R.A.T.AG 108 98 80 80 77 60 -44R.A.T.S 50 35 26 26 26 25 -50% / Parc Total 60 60,4 57,7 62,3 64,26 58,5 60,5Source : é<strong>la</strong>borer à partir <strong>de</strong>s données <strong>de</strong> <strong>la</strong> D.E.P.P, rapport 2001.Table<strong>au</strong> n° 2 : Nombre d’Agents par apport <strong>au</strong> parc circu<strong>la</strong>nt <strong>de</strong>s régies en 2000.Régies RATM RATUF RATC RATAG RATR-S RATS RATR-S Tot.RegiesAgents/Bus20008,52 7,39 8 12 10,8 9 10,8 8,58Source: Calculer à partir <strong>de</strong>s données précédantes.Table<strong>au</strong> n° 3 : Résultat par voyageur par régie entre 1995 et 2000.Année\regie R.A.T.C. R.A.T.R. R.A.T.M. R.A.T.F. R.A.T.AG. R.A.T.S.1995 -0,5842 -0,1001 -0,3825 0,0426 -0,1502 -0,27591996 -0,5529 -0,9323 -0,3975 0,0234 -0,4242 -0,38871997 -0,2514 0,5735 -0,9021 0,0231 -0,3178 -0,25351998 -0,4114 -0,2473 -0,5108 0,0122 -0,3972 -0,28361999 -0,3883 -0,2054 -0,7182 -0,0146 -0,5032 -0,00782000 -0,3060 -0,3928 -0,6118 -0,0247 -0,6638 -0,2034Moyenne -0,4157 -0,2174 -0,5871 0,0103 -0,4094 -0,2355Source : E<strong>la</strong>boré à partir <strong>de</strong>s données <strong>de</strong> <strong>la</strong> Direction <strong>de</strong>s Régies et Services Concédés. 86-91Table<strong>au</strong> n° 3-1 : Résultat d’exploitation <strong>de</strong>s régies entre 1970 et 1979.Année. 1970 1971 1972 1973 1974 1975 1976 1977 1978 1979 MoyenneRésultat4869 5926 8758 3757 16750 2372 2722 6450d’exp.(en1000DH.)Res./ -0,013 -0,004 0,003 0,022 0,0248 0,034 0,01356 0,0544 0,00748 0,00748 0,0228Voyageur (DH)Source : 1970-1978 établie à partir <strong>de</strong> « étu<strong>de</strong> <strong>de</strong>s problèmes et perspectives <strong>de</strong> transport <strong>urbain</strong> », 1979.23