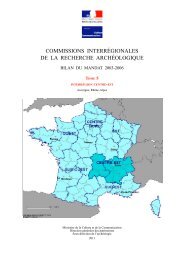
commissions interregionales de la recherche archeologique
commissions interregionales de la recherche archeologique
commissions interregionales de la recherche archeologique

You also want an ePaper? Increase the reach of your titles
YUMPU automatically turns print PDFs into web optimized ePapers that Google loves.
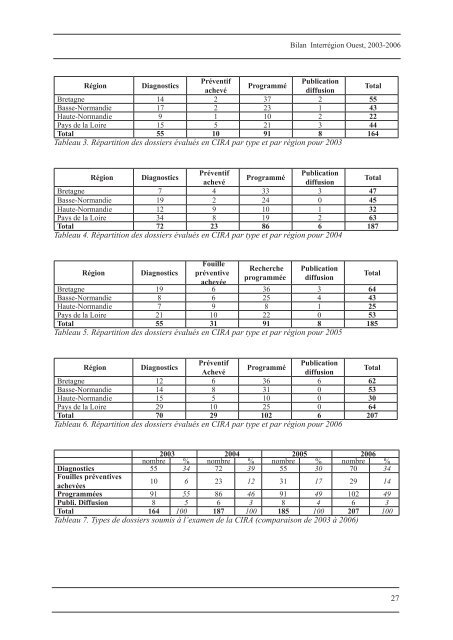
Bi<strong>la</strong>n Interrégion Ouest, 2003-2006<br />
Région Diagnostics<br />
Préventif<br />
achevé<br />
Programmé<br />
Publication<br />
diffusion<br />
Total<br />
Bretagne 14 2 37 2 55<br />
Basse-Normandie 17 2 23 1 43<br />
Haute-Normandie 9 1 10 2 22<br />
Pays <strong>de</strong> <strong>la</strong> Loire 15 5 21 3 44<br />
Total 55 10 91 8 164<br />
Tableau 3. Répartition <strong>de</strong>s dossiers évalués en CIRA par type et par région pour 2003<br />
Région Diagnostics<br />
Préventif<br />
achevé<br />
Programmé<br />
Publication<br />
diffusion<br />
Total<br />
Bretagne 7 4 33 3 47<br />
Basse-Normandie 19 2 24 0 45<br />
Haute-Normandie 12 9 10 1 32<br />
Pays <strong>de</strong> <strong>la</strong> Loire 34 8 19 2 63<br />
Total 72 23 86 6 187<br />
Tableau 4. Répartition <strong>de</strong>s dossiers évalués en CIRA par type et par région pour 2004<br />
Région Diagnostics<br />
Fouille<br />
préventive<br />
achevée<br />
Recherche<br />
programmée<br />
Publication<br />
diffusion<br />
Bretagne 19 6 36 3 64<br />
Basse-Normandie 8 6 25 4 43<br />
Haute-Normandie 7 9 8 1 25<br />
Pays <strong>de</strong> <strong>la</strong> Loire 21 10 22 0 53<br />
Total 55 31 91 8 185<br />
Tableau 5. Répartition <strong>de</strong>s dossiers évalués en CIRA par type et par région pour 2005<br />
Total<br />
Région Diagnostics<br />
Préventif<br />
Achevé<br />
Programmé<br />
Publication<br />
diffusion<br />
Total<br />
Bretagne 12 6 36 6 62<br />
Basse-Normandie 14 8 31 0 53<br />
Haute-Normandie 15 5 10 0 30<br />
Pays <strong>de</strong> <strong>la</strong> Loire 29 10 25 0 64<br />
Total 70 29 102 6 207<br />
Tableau 6. Répartition <strong>de</strong>s dossiers évalués en CIRA par type et par région pour 2006<br />
Diagnostics<br />
2003<br />
nombre<br />
55<br />
%<br />
34<br />
2004<br />
nombre<br />
72<br />
%<br />
39<br />
2005<br />
nombre<br />
55<br />
%<br />
30<br />
2006<br />
nombre<br />
70<br />
%<br />
34<br />
Fouilles préventives<br />
10 6 23 12 31 17 29 14<br />
achevées<br />
Programmées 91 55 86 46 91 49 102 49<br />
Publi. Diffusion 8 5 6 3 8 4 6 3<br />
Total 164 100 187 100 185 100 207 100<br />
Tableau 7. Types <strong>de</strong> dossiers soumis à l’examen <strong>de</strong> <strong>la</strong> CIRA (comparaison <strong>de</strong> 2003 à 2006)<br />
27