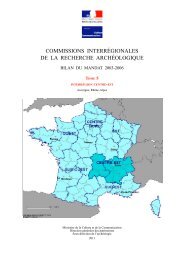
commissions interregionales de la recherche archeologique
commissions interregionales de la recherche archeologique
commissions interregionales de la recherche archeologique

You also want an ePaper? Increase the reach of your titles
YUMPU automatically turns print PDFs into web optimized ePapers that Google loves.
Bi<strong>la</strong>n Interrégion Ouest, 2003-2006<br />
2002-2006 2002 2003<br />
Saisines<br />
2004 2005 2006<br />
Répartition <strong>de</strong>s mo<strong>de</strong>s <strong>de</strong><br />
transmission *<br />
Instr. Amén. Autre<br />
Alsace 719 872 820 764 886 96,53% 3,47%<br />
Aquitaine 1 357 1 710 1 603 1 527 1 724 98,07% 1,81% 0,12%<br />
Auvergne 900 1 011 1 035 1 146 1 141 74,89% 1,57% 23,54%<br />
Bourgogne 940 1 085 1 208 981 637 94,25% 4,40% 1,36%<br />
Bretagne 582 1 467 1 393 772 659 96,27% 3,68% 0,05%<br />
Centre 1 400 2 429 3 351 3 434 3 712 96,41% 3,52% 0,07%<br />
Champagne-Ar<strong>de</strong>nne 780 822 928 1 000 1 223 81,60% 18,40%<br />
Corse 126 34 76 115 176 99,75% 0,25%<br />
Franche-Comté 429 872 1 429 1 260 1 180 96,92% 2,83% 0,25%<br />
Ile-<strong>de</strong>-France 2 098 2 395 3 062 2 917 2 989 94,16% 5,84%<br />
Languedoc-Roussillon 819 974 1 322 1 109 1 075 96,05% 3,95%<br />
Limousin 102 187 324 437 466 91,30% 5,37% 3,32%<br />
Lorraine 1 394 1 384 2 149 1 987 1 940 98,38% 1,62%<br />
Midi-Pyrénées 420 733 788 826 78,82% 1,83% 19,34%<br />
Nord-Pas-<strong>de</strong>-Ca<strong>la</strong>is 1 379 2 621 3 150 4 490 4 986 87,28% 10,78% 1,95%<br />
Basse-Normandie 391 563 734 931 1 010 79,59% 14,79% 5,62%<br />
Haute-Normandie 1 080 865 1 046 1 480 1 542 96,55% 3,30% 0,14%<br />
Pays <strong>de</strong> <strong>la</strong> Loire 1 095 1 574 1 834 1 206 1 108 84,90% 10,28% 4,82%<br />
Picardie 2 052 2 316 2 494 2 516 2 980 87,73% 11,33% 0,94%<br />
Poitou-Charentes 2 123 1 438 1 433 2 499 3 562 97,50% 2,50%<br />
Provence-Alpes-Côte-d’Azur 788 959 1 470 1 436 1 584 97,21% 2,79%<br />
Rhône-Alpes 2 173 2 801 2 895 2 183 2 317 70,15% 2,26% 27,59%<br />
Gua<strong>de</strong>loupe 137 452 371 545 94,15% 3,19% 2,66%<br />
Martinique 51 76 87 89 82,51% 5,61% 11,88%<br />
Guyane 63 191 119 132 97,62% 2,38%<br />
National 23 147 29 363 35 263 35 593 37 663 90,49% 5,63% 3,88%<br />
(*) Les pourcentages sont établis sur les années postérieures à 2002, les données <strong>de</strong> 2002 ne permettant pas cette répartition.<br />
Instr. Transmission du dossier dans le cadre d’une procédure d’instruction préa<strong>la</strong>ble à autorisation<br />
Amén. Transmission du dossier directement par l’aménageur au service (DVRD essentiellement)<br />
Autre Autre mo<strong>de</strong> <strong>de</strong> transmission, saisine directe du Préfet <strong>de</strong> région notamment<br />
Tableau 12. Nombre <strong>de</strong> saisines <strong>de</strong> 2002 à 2006 instruites par les SRA <strong>de</strong> l’ensemble <strong>de</strong> <strong>la</strong> France<br />
(source SDArchetis)<br />
31