Il Documento annuale di programmazione 2003 ... - Regione Umbria
Il Documento annuale di programmazione 2003 ... - Regione Umbria
Il Documento annuale di programmazione 2003 ... - Regione Umbria

Create successful ePaper yourself
Turn your PDF publications into a flip-book with our unique Google optimized e-Paper software.
48<br />
Supplemento straor<strong>di</strong>nario al «Bollettino Ufficiale» - serie generale - n. 10 del 5 marzo <strong>2003</strong><br />
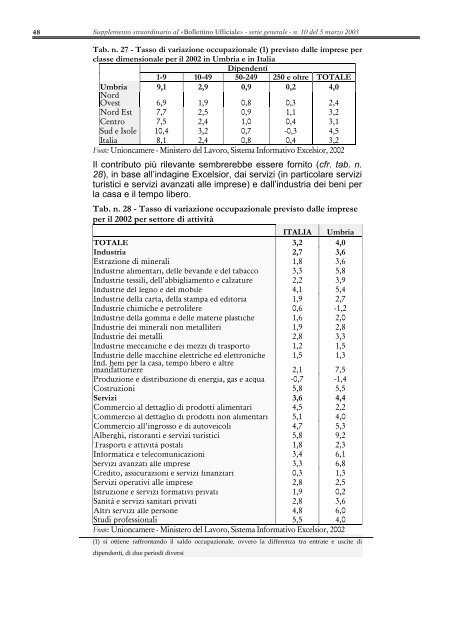
Tab. n. 27 - Tasso <strong>di</strong> variazione occupazionale (1) previsto dalle imprese per<br />
classe <strong>di</strong>mensionale per il 2002 in <strong>Umbria</strong> e in Italia<br />
Dipendenti<br />
1-9 10-49 50-249 250 e oltre TOTALE<br />
<strong>Umbria</strong> 9,1 2,9 0,9 0,2 4,0<br />
Nord<br />
Ovest 6,9 1,9 0,8 0,3 2,4<br />
Nord Est 7,7 2,5 0,9 1,1 3,2<br />
Centro 7,5 2,4 1,0 0,4 3,1<br />
Sud e Isole 10,4 3,2 0,7 -0,3 4,5<br />
Italia 8,1 2,4 0,8 0,4 3,2<br />
Fonte: Unioncamere - Ministero del Lavoro, Sistema Informativo Excelsior, 2002<br />
<strong>Il</strong> contributo più rilevante sembrerebbe essere fornito (cfr. tab. n.<br />
28), in base all’indagine Excelsior, dai servizi (in particolare servizi<br />
turistici e servizi avanzati alle imprese) e dall’industria dei beni per<br />
la casa e il tempo libero.<br />
Tab. n. 28 - Tasso <strong>di</strong> variazione occupazionale previsto dalle imprese<br />
per il 2002 per settore <strong>di</strong> attività<br />
ITALIA <strong>Umbria</strong><br />
TOTALE 3,2 4,0<br />
Industria 2,7 3,6<br />
Estrazione <strong>di</strong> minerali 1,8 3,6<br />
Industrie alimentari, delle bevande e del tabacco 3,3 5,8<br />
Industrie tessili, dell'abbigliamento e calzature 2,2 3,9<br />
Industrie del legno e del mobile 4,1 5,4<br />
Industrie della carta, della stampa ed e<strong>di</strong>toria 1,9 2,7<br />
Industrie chimiche e petrolifere 0,6 -1,2<br />
Industrie della gomma e delle materie plastiche 1,6 2,0<br />
Industrie dei minerali non metalliferi 1,9 2,8<br />
Industrie dei metalli 2,8 3,3<br />
Industrie meccaniche e dei mezzi <strong>di</strong> trasporto 1,2 1,5<br />
Industrie delle macchine elettriche ed elettroniche<br />
Ind. beni per la casa, tempo libero e altre<br />
manifatturiere<br />
1,5<br />
2,1<br />
1,3<br />
7,5<br />
Produzione e <strong>di</strong>stribuzione <strong>di</strong> energia, gas e acqua -0,7 -1,4<br />
Costruzioni 5,8 5,5<br />
Servizi 3,6 4,4<br />
Commercio al dettaglio <strong>di</strong> prodotti alimentari 4,5 2,2<br />
Commercio al dettaglio <strong>di</strong> prodotti non alimentari 5,1 4,0<br />
Commercio all'ingrosso e <strong>di</strong> autoveicoli 4,7 5,3<br />
Alberghi, ristoranti e servizi turistici 5,8 9,2<br />
Trasporti e attività postali 1,8 2,3<br />
Informatica e telecomunicazioni 3,4 6,1<br />
Servizi avanzati alle imprese 3,3 6,8<br />
Cre<strong>di</strong>to, assicurazioni e servizi finanziari 0,3 1,3<br />
Servizi operativi alle imprese 2,8 2,5<br />
Istruzione e servizi formativi privati 1,9 0,2<br />
Sanità e servizi sanitari privati 2,8 3,6<br />
Altri servizi alle persone 4,8 6,0<br />
Stu<strong>di</strong> professionali 5,5 4,0<br />
Fonte: Unioncamere - Ministero del Lavoro, Sistema Informativo Excelsior, 2002<br />
(1) si ottiene raffrontando il saldo occupazionale, ovvero la <strong>di</strong>fferenza tra entrate e uscite <strong>di</strong><br />
<strong>di</strong>pendenti, <strong>di</strong> due perio<strong>di</strong> <strong>di</strong>versi