

Dossier Corea del Sud - Ambasciata d'Italia in Corea
Dossier Corea del Sud - Ambasciata d'Italia in Corea
Dossier Corea del Sud - Ambasciata d'Italia in Corea

You also want an ePaper? Increase the reach of your titles
YUMPU automatically turns print PDFs into web optimized ePapers that Google loves.
<strong>Dossier</strong> <strong>Corea</strong> <strong>del</strong> <strong>Sud</strong> L’impresa verso i mercati <strong>in</strong>ternazionaLi<br />
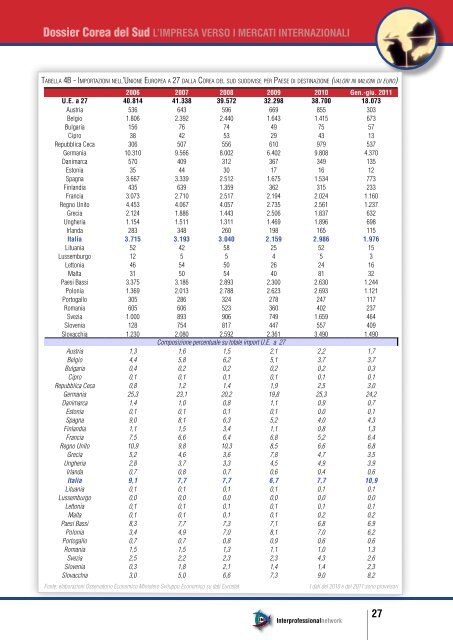
tAbellA 4b - importAzioni nell’unione europeA A 27 dAllA coreA <strong>del</strong> sud suddivise per pAese di dest<strong>in</strong>Azione (valori <strong>in</strong> milioni di euro)<br />
2006 2007 2008 2009 2010 Gen.-giu. 2011<br />
U.e. a 27 40.814 41.338 39.572 32.298 38.700 18.073<br />
Austria 536 643 596 669 855 303<br />
Belgio 1.806 2.392 2.440 1.643 1.415 673<br />
Bulgaria 156 76 74 49 75 57<br />
Cipro 38 42 53 29 43 13<br />
Repubblica Ceca 306 507 556 610 979 537<br />
Germania 10.310 9.566 8.002 6.402 9.808 4.370<br />
Danimarca 570 409 312 367 349 135<br />
Estonia 35 44 30 17 16 12<br />
Spagna 3.667 3.339 2.512 1.675 1.534 773<br />
F<strong>in</strong>landia 435 639 1.359 362 315 233<br />
Francia 3.073 2.710 2.517 2.194 2.024 1.160<br />
Regno Unito 4.453 4.067 4.057 2.735 2.561 1.237<br />
Grecia 2.124 1.886 1.443 2.506 1.837 632<br />
Ungheria 1.154 1.511 1.311 1.469 1.896 698<br />
Irlanda 283 348 260 198 165 115<br />
Italia 3.715 3.193 3.040 2.159 2.986 1.976<br />
Lituania 52 42 58 25 52 15<br />
Lussemburgo 12 5 5 4 5 3<br />
Lettonia 46 54 50 26 24 16<br />
Malta 31 50 54 40 81 32<br />
Paesi Bassi 3.375 3.186 2.893 2.300 2.630 1.244<br />
Polonia 1.369 2.013 2.788 2.623 2.693 1.121<br />
Portogallo 305 286 324 278 247 117<br />
Romania 605 606 523 360 402 237<br />
Svezia 1.000 893 906 749 1.659 464<br />
Slovenia 128 754 817 447 557 409<br />
Slovacchia 1.230 2.080 2.592 2.361 3.490 1.490<br />
Composizione percentuale su totale import U.E. a 27<br />
Austria 1,3 1,6 1,5 2,1 2,2 1,7<br />
Belgio 4,4 5,8 6,2 5,1 3,7 3,7<br />
Bulgaria 0,4 0,2 0,2 0,2 0,2 0,3<br />
Cipro 0,1 0,1 0,1 0,1 0,1 0,1<br />
Repubblica Ceca 0,8 1,2 1,4 1,9 2,5 3,0<br />
Germania 25,3 23,1 20,2 19,8 25,3 24,2<br />
Danimarca 1,4 1,0 0,8 1,1 0,9 0,7<br />
Estonia 0,1 0,1 0,1 0,1 0,0 0,1<br />
Spagna 9,0 8,1 6,3 5,2 4,0 4,3<br />
F<strong>in</strong>landia 1,1 1,5 3,4 1,1 0,8 1,3<br />
Francia 7,5 6,6 6,4 6,8 5,2 6,4<br />
Regno Unito 10,9 9,8 10,3 8,5 6,6 6,8<br />
Grecia 5,2 4,6 3,6 7,8 4,7 3,5<br />
Ungheria 2,8 3,7 3,3 4,5 4,9 3,9<br />
Irlanda 0,7 0,8 0,7 0,6 0,4 0,6<br />
Italia 9,1 7,7 7,7 6,7 7,7 10,9<br />
Lituania 0,1 0,1 0,1 0,1 0,1 0,1<br />
Lussemburgo 0,0 0,0 0,0 0,0 0,0 0,0<br />
Lettonia 0,1 0,1 0,1 0,1 0,1 0,1<br />
Malta 0,1 0,1 0,1 0,1 0,2 0,2<br />
Paesi Bassi 8,3 7,7 7,3 7,1 6,8 6,9<br />
Polonia 3,4 4,9 7,0 8,1 7,0 6,2<br />
Portogallo 0,7 0,7 0,8 0,9 0,6 0,6<br />
Romania 1,5 1,5 1,3 1,1 1,0 1,3<br />
Svezia 2,5 2,2 2,3 2,3 4,3 2,6<br />
Slovenia 0,3 1,8 2,1 1,4 1,4 2,3<br />
Slovacchia 3,0 5,0 6,6 7,3 9,0 8,2<br />
Fonte: elaborazioni Osservatorio Economico M<strong>in</strong>istero Sviluppo Economico su dati Eurostat I dati <strong>del</strong> 2010 e <strong>del</strong> 2011 sono provvisori<br />
Interprofessionalnetwork<br />
27