Scarica la pubblicazione in formato .pdf - Veneto Agricoltura
Scarica la pubblicazione in formato .pdf - Veneto Agricoltura
Scarica la pubblicazione in formato .pdf - Veneto Agricoltura

Create successful ePaper yourself
Turn your PDF publications into a flip-book with our unique Google optimized e-Paper software.
(17,3%), Padova (16,9%), Venezia (12,7%), Vicenza (12,5%), Rovigo (10,5%) e, <strong>in</strong>f<strong>in</strong>e,<br />
da Belluno con appena l’1,9%. La distribuzione percentuale delle aziende agricole<br />
secondo i macro <strong>in</strong>dirizzi produttivi, specializzato e misto, conferma per tutte<br />
le prov<strong>in</strong>ce una più che netta prevalenza dei primi sui secondi, accentuatasi ulteriormente<br />
rispetto al 1990, fatta eccezione per <strong>la</strong> prov<strong>in</strong>cia di Belluno, <strong>la</strong> cui <strong>in</strong>cidenza<br />
percentuale delle aziende “specializzate” è ca<strong>la</strong>ta dal 75,4% al 73,3%. In partico<strong>la</strong>re,<br />
Rovigo (91,2% dell’universo prov<strong>in</strong>ciale c<strong>la</strong>ssificato), Verona (89,6%) e<br />
Padova (87,6%) risultano aver registrato le maggiori <strong>in</strong>cidenze percentuali rispetto<br />
al<strong>la</strong> media (84,3%), mentre <strong>in</strong>cidenze percentuali <strong>in</strong>feriori sono state registrate dalle<br />
prov<strong>in</strong>ce di Vicenza (81,7%), Treviso (80,3%) e Belluno (73,3%).<br />
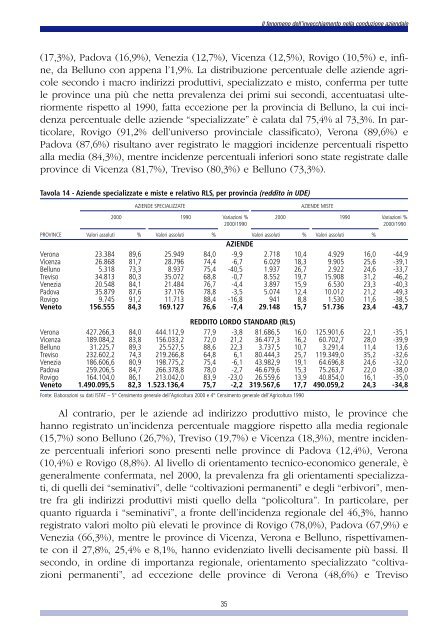
Tavo<strong>la</strong> 14 - Aziende specializzate e miste e re<strong>la</strong>tivo RLS, per prov<strong>in</strong>cia (reddito <strong>in</strong> UDE)<br />
AZIENDE SPECIALIZZATE AZIENDE MISTE<br />
2000 1990 Variazioni % 2000 1990 Variazioni %<br />
2000/1990 2000/1990<br />
PROVINCE Valori assoluti % Valori assoluti % Valori assoluti % Valori assoluti %<br />
AZIENDE<br />
Verona 23.384 89,6 25.949 84,0 -9,9 2.718 10,4 4.929 16,0 -44,9<br />
Vicenza 26.868 81,7 28.796 74,4 -6,7 6.029 18,3 9.905 25,6 -39,1<br />
Belluno 5.318 73,3 8.937 75,4 -40,5 1.937 26,7 2.922 24,6 -33,7<br />
Treviso 34.813 80,3 35.072 68,8 -0,7 8.552 19,7 15.908 31,2 -46,2<br />
Venezia 20.548 84,1 21.484 76,7 -4,4 3.897 15,9 6.530 23,3 -40,3<br />
Padova 35.879 87,6 37.176 78,8 -3,5 5.074 12,4 10.012 21,2 -49,3<br />
Rovigo 9.745 91,2 11.713 88,4 -16,8 941 8,8 1.530 11,6 -38,5<br />
<strong>Veneto</strong> 156.555 84,3 169.127 76,6 -7,4 29.148 15,7 51.736 23,4 -43,7<br />
REDDITO LORDO STANDARD (RLS)<br />
Verona 427.266,3 84,0 444.112,9 77,9 -3,8 81.686,5 16,0 125.901,6 22,1 -35,1<br />
Vicenza 189.084,2 83,8 156.033,2 72,0 21,2 36.477,3 16,2 60.702,7 28,0 -39,9<br />
Belluno 31.225,7 89,3 25.527,5 88,6 22,3 3.737,5 10,7 3.291,4 11,4 13,6<br />
Treviso 232.602,2 74,3 219.266,8 64,8 6,1 80.444,3 25,7 119.349,0 35,2 -32,6<br />
Venezia 186.606,6 80,9 198.775,2 75,4 -6,1 43.982,9 19,1 64.696,8 24,6 -32,0<br />
Padova 259.206,5 84,7 266.378,8 78,0 -2,7 46.679,6 15,3 75.263,7 22,0 -38,0<br />
Rovigo 164.104,0 86,1 213.042,0 83,9 -23,0 26.559,6 13,9 40.854,0 16,1 -35,0<br />
<strong>Veneto</strong> 1.490.095,5 82,3 1.523.136,4 75,7 -2,2 319.567,6 17,7 490.059,2 24,3 -34,8<br />
Fonte: E<strong>la</strong>borazioni su dati ISTAT – 5° Censimento generale dell’<strong>Agricoltura</strong> 2000 e 4° Censimento generale dell’<strong>Agricoltura</strong> 1990<br />
Al contrario, per le aziende ad <strong>in</strong>dirizzo produttivo misto, le prov<strong>in</strong>ce che<br />
hanno registrato un’<strong>in</strong>cidenza percentuale maggiore rispetto al<strong>la</strong> media regionale<br />
(15,7%) sono Belluno (26,7%), Treviso (19,7%) e Vicenza (18,3%), mentre <strong>in</strong>cidenze<br />
percentuali <strong>in</strong>feriori sono presenti nelle prov<strong>in</strong>ce di Padova (12,4%), Verona<br />
(10,4%) e Rovigo (8,8%). Al livello di orientamento tecnico-economico generale, è<br />
generalmente confermata, nel 2000, <strong>la</strong> prevalenza fra gli orientamenti specializzati,<br />
di quelli dei “sem<strong>in</strong>ativi”, delle “coltivazioni permanenti” e degli “erbivori”, mentre<br />
fra gli <strong>in</strong>dirizzi produttivi misti quello del<strong>la</strong> “policoltura”. In partico<strong>la</strong>re, per<br />
quanto riguarda i “sem<strong>in</strong>ativi”, a fronte dell’<strong>in</strong>cidenza regionale del 46,3%, hanno<br />
registrato valori molto più elevati le prov<strong>in</strong>ce di Rovigo (78,0%), Padova (67,9%) e<br />
Venezia (66,3%), mentre le prov<strong>in</strong>ce di Vicenza, Verona e Belluno, rispettivamente<br />
con il 27,8%, 25,4% e 8,1%, hanno evidenziato livelli decisamente più bassi. Il<br />
secondo, <strong>in</strong> ord<strong>in</strong>e di importanza regionale, orientamento specializzato “coltivazioni<br />
permanenti”, ad eccezione delle prov<strong>in</strong>ce di Verona (48,6%) e Treviso<br />
35<br />
Il fenomeno dell’<strong>in</strong>vecchiamento nel<strong>la</strong> conduzione aziendale