


Create successful ePaper yourself
Turn your PDF publications into a flip-book with our unique Google optimized e-Paper software.
Aktiva og passiva<br />
Assets and liabilities<br />
Aktiva Assets<br />
I. Kassebeholdning Cash in hand<br />
II. Bankinnskott Deposits with banks<br />
Ihendehaverobligasjoner Bearer bonds<br />
1. Stats- og statsgaranterte Government and Government<br />
-guaranteed bonds<br />
2. Andre Other<br />
IV. Aksjer Shares<br />
V. Utlån Loans<br />
VI. Andre aktiva Other assets<br />
Aktiva i alt Total assets<br />
Passiva Liabilities<br />
I. Forsikringsforpliktelser Insurance liabilities<br />
II. Annen gjeld Other debt<br />
Passiva i alt Total liabilities<br />
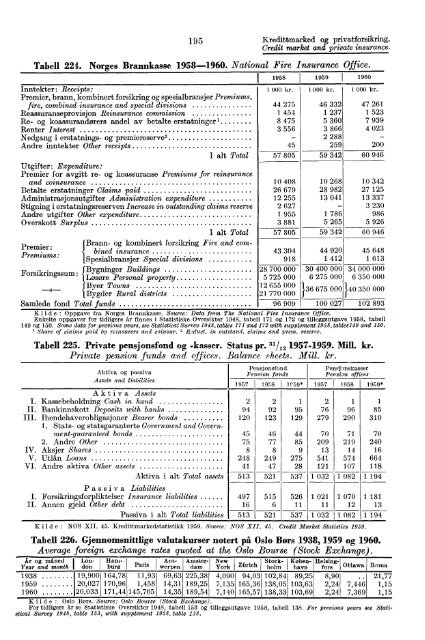
1 95 Kredittmarked og privatforsikring.<br />
Credit market and private insurance.<br />
Tabell 224. Norges Brannkasse 1958-1960. National Fire Insurance Office.<br />
I 1058 1959 1960<br />
Inntekter : Receipts:<br />
1 000 kr. 1 000 kr. 1 000 kr.<br />
Premier, brann, kombinert forsikring og spesialbransjer Premiums,<br />
fire, combined insurance and special divisions<br />
44 275 46 332 47 261<br />
Reassuranseprovisjon Reinsurance commission<br />
1 454 1 237 1 523<br />
Re- og koassurandørers andel av betalte erstatninger<br />
Renter Interest<br />
Nedgang i erstatnings- og premiereserve'<br />
Andre inntekter Other receipts<br />
8 475<br />
3 556<br />
45<br />
5 360<br />
3 866<br />
2 288<br />
259<br />
7 939<br />
4 023<br />
200<br />
I alt Total I 57 805 59 342 60 946<br />
Utgifter : Expenditure:<br />
Premier for avgitt re- og koassuranse Premiums for reinsurance<br />
and coinsurance 10 408<br />
Betalte erstatninger Claims paid 26 679<br />
Administrasjonsutgifter Administration expenditure 12 255<br />
Stigning i erstatningsreserven Increase in outstanding claims reserve 2 627<br />
Andre utgifter Other expenditure 1 955<br />
Overskott Surplus 3 881<br />
I alt Total 57 805<br />
Brann- og kombinert forsikring Fire and com-<br />
Premier :<br />
bined insurance<br />
43 304<br />
Premiums:<br />
I<br />
Spesialbransjer Special divisions I 918<br />
Bygninger Buildings 1 28 700 000<br />
Forsikringssum :<br />
Løsere Personal property I 5 725 000<br />
Byer Towns 12 655 000<br />
-»-<br />
Bygder Rural districts 21 770 000<br />
Samlede fond Total funds 96 909<br />
Pensjonsfond<br />
Pension funds<br />
1957 I 1958 l 0 59*<br />
10 268 10 342<br />
28 982 27 125<br />
13 041 13 337<br />
3 230<br />
1 786 986<br />
5 265 5 926<br />
59 342 60 946<br />
44 920 45 648<br />
1 412 1 613<br />
30 400 000 34 000 000<br />
6 275 000 6 350 000<br />
1 36 675 000 140 350 000<br />
100 027 102 893<br />
Kilde : Oppgave fra Norges Brannkasse. Source: Data from The National Fire Insurance Office.<br />
Enkelte oppgaver for tidligere år finnes i Statistiske Oversikter 1948, tabell 171 og 172 og tilleggsutgave 1958, tabell<br />
149 og 150. Some data for previous years, see Statistical Survey 1948, tables 171 and 172 with supplement 1958, tables149 and 150.<br />
I Share of claims paid by reinsurers and coinsur. 2 R,duct. in outstand. claims and prem. reserve.<br />
Tabell 225. Private pensjonsfond og -kasser. Status pr. 31/12 1957-1959. Mill. kr.<br />
Private pension funds and offices. Balance sheets. Mill. kr.<br />
Pensjonskasser<br />
Pension offices<br />
1957 1958 I 1959*<br />
2 2 1 2 1 1<br />
94 92 95 76 96 85<br />
120 123 129 279 290 310<br />
45 46 44 70 71 70<br />
75 77 85 209 219 240<br />
8 8 9 13 14 16<br />
248 249 275 541 574 664<br />
41 47 28 121 107 118<br />
513 521 537 1 032 1 082 1 194<br />
497 515 526 1 021 1 070 1 181<br />
16 6 11 11 12 13<br />
513 521 537 1 032 1 082 1 194<br />
Kild e : NOS XII. 45. Kredittmarkedstatistikk 1959. Source: NOS XII. 45. Credit Market Statistics 1959.<br />
Tabell 226. Gjennomsnittlige valutakurser notert på Oslo Bon 1938, 1959 og 1960.<br />
Average foreign exchange rates quoted at the Oslo Bourse (Stock Exchange).<br />
Ar og måned I Lon- Hamburg<br />
Paris werpen<br />
Amster-<br />
New<br />
Stock-<br />
Antdam<br />
York Zürich holm<br />
Kobenhavfors<br />
Ottawa Roma<br />
Helsing-<br />
Year and month I don<br />
1938 119,900 164,78 11,93 69,63 225,38 4,090 94,03 102,84 89,25 8,90 21,77<br />
1959 20,027 170,96 1,458 14,31 189,25 7,135 165,36 138,05 103,63 2,24 7,446 1,15<br />
1960 20,033 171,44 145,765 14,35 189,54 7,140 165,57 138,33 103,69 2,24 7,369 1,15<br />
Kilde : Oslo Bors. Source: Oslo Bourse (Stock Exchange).<br />
For tidligere Ar se Statistiske Oversikter 1948, tabell 153 og tilleggsutgave 1958, tabell 138. For previous years see Statistical<br />
Survey 1948, table 153, with supplement 1958. table 138.


