Jordbruk m. v. 80 Agriculture etc. Tabell 91. Eiendomsforhold og brukerskifte. Bruk over 5 dekar jordbruksareal. 1958. Farm tenure and transfers. Holdings with more than 5 decares of agricultural land. Tallet p a bruk No. of holdings Undersokte bruk i alt Holdings reported. Leide bruk Rented Selveide bruk Freeholds Av disse: Of which: Slektsbruk Family transfers Vanlige Ordinary Opprettet av eieren Settled by the owner Ikke slektsbruk Not family transfers Vanlige Ordinary Opprettet av eieren Settled by the owner Prosent av selveide bruk 1 Overtatt 2 for Transferred before 1920 1920-1929 1930-1939 1940-1949 1950-1958 Arstall uoppgitt Unknown Eierens alder ved siste eierskifte Age of owner by time of transfer : Inntil Up to 29 Al. years 30-39 » » 40-49 e 50 ar og over and over Alder uoppgitt Unknown Forrige eiers alder ved siste eierskifte Age of previous owner by time of transfer: Inntil Up to 59 ar years 60-69 » » 70 ar og over and over Alder uoppgitt Unknown Slektskap mellom forrige og nay. eier : 3 Forrige eier var: Previous owner was: Foreldre (sviger-) Parents (in law) Nhvnrende eier var: Present owner was: neste eller eldste sonn Only or eldest son. . . Annen sonn Other son Eneste el. eldste clatter' Only or eldest daughter Annen datter Other daughter Annen slektning Other relative Ikke slektning Not relative Eiers fam.forh. Owner's fam. relat.ship Eier ikke gift Owner single Eier gift eller for gift' uten barn without children med » with Eier regner med fremtidig overdragelse til: Owner expects future transfer to: barn Slektning Relatives children ndre others Ikke slektning Not relatives Uoppgitt Unknown Gjennomsnittsalder are Forrige eier Previous owner v. eierskifte by transfer Navwr. eier Present owner v. eierskifte by transfer v. ekteskap by marriage i tell.aret (1958) by survey Brukene etter jordbruksareal, dekar Holdings by area of agric.land, decares 5,1-20 20,1-50 50,1-100 over 100 I alt Total Av disse vanlige slektsbruk Of which family transfers, ordinary Overt. Transfer. I alt Total For 1940 Before Etter 1940 After 6 413 8 411 4 496 2 042 21 362 13 406 5 448 7 422 666 648 352 296 1 962 5 747 7 763 4 144 1 746 19 400 13 406 5 448 7 422 3 305 5 385 3 242 1 474 13 406 13 406 5 448 7 422 306 330 105 17 758 1 321 1 334 633 247 3 535 815 714 164 8 1 701 9,4 7,9 5,7 4,9 7,6 6,5 14,9 14,2 15,6 12,8 14,5 13,3 100,0 24,8 24,9 23,7 23,5 24,5 22,5 24,6 25,3 26,8 27,8 25,6 28,1 100,0 18,6 22,4 25,3 29,6 22,6 25,4 7,7 5,3 2,9 1,4 5,2 4,2 28,5 31,7 35,2 35,1 31,8 31,8 46,8 22,9 36,0 39,6 41,6 43,4 39,3 40,1 39,4 43,5 18,6 16,8 15,0 15,2 16,8 17,3 10,5 23,5 7,2 5,1 4,2 3,8 5,4 5,1 1,4 8,3 9,7 6,8 4,0 2,5 6,7 5,7 1,9 1,8 17,1 17,0 18,2 19,7 17,5 15,0 18,4 13,3 20,3 26,9 34,4 35,9 27,4 33,2 34,4 34,0 29,8 31,8 31,9 32,0 31,2 39,4 35,2 44,4 32,8 24,3 15,5 12,4 23,9 12,4 12,0 8,3 50,8 61,7 70,0 75,3 61,5 84,3 86,2 84,9 42,3 50,8 58,3 65,1 52,3 52,3 49,8 55,1 38,1 35,7 31,1 26,3 34,0 34,0 36,0 32,1 5,2 3,0 3,5 3,0 3,7 3,7 3,8 3,5 14,4 10,5 7,1 5,6 10,0 10,0 10,4 9,3 12,0 11,9 10,8 10,1 11,5 15,7 13,8 15,1 37,2 26,4 19,2 14,6 27,0 13,5 14,8 14,6 12,6 14,2 17,2 13,3 20,1 10,0 8,5 6,9 6,5 8,4 7,5 7,3 7,1 76,5 76,7 78,5 80,9 77,4 75,3 79,4 72,8 58,4 62,2 68,2 71,8 63,2 63,1 67,6 60,5 9,2 10,2 12,3 13,8 10,7 11,9 10,8 13,0 14,7 10,7 5,4 3,4 10,1 9,1 9,9 8,4 17,7 16,9 14,1 11,0 16,0 15,9 11,7 18,1 67 67 67 66 67 68 67 69 35 34 33 33 34 34 31 36 31 32 30 31 31 31 30 32 55 53 51 50 53 51 60 45 Kilda : NOS XII. 46. Jordbruksstatistikk 1959. Source: NOS XII. 46. Agricultural statistics 2959. Per cent of freeholds. a Ikke skiftet eier siden. Not transferred since then. 3 Relationship to previous owner. ° IT ten brut. Without brother. b Owner married or previously married. 6 Average age, years.
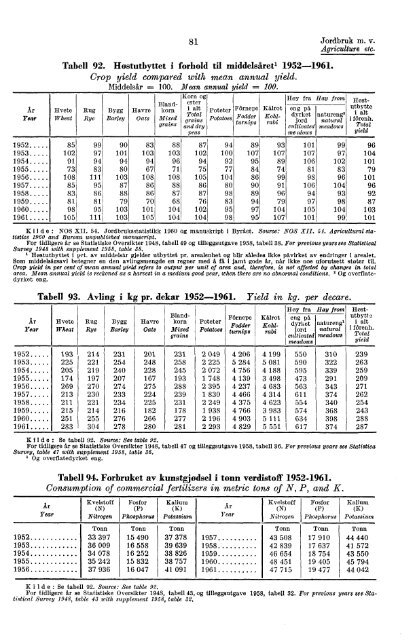
Ar Year 1952 1953 1954 1955 1956 1957 1958 1959 1960 1961 Ar Year Hvete Wheat Rug Rye Bygg Barley Havre Oats Blandkorn Mixed grains 81 Jordbruk m. v. Agriculture etc. Tabell 92. Hostutbyttet i forhold til middelsfiretl 1952—.1961. Crop yield compared with mean annual yield. Middelshr 100. Mean annual yield = 100. Hvete Wheat Rug Rye Bygg Barley Havre Oats Blandkorn Mixed grains Korn og erter 1 alt Total grains • and dry peas poteter Potatoes Poteter Potatoes FOrnepe Fodder turnips FOrnepe Fodder turnips by fra Hay from eng ph dyrket jord cultivated me glows natureng 2 natural meadows Hoy fra Hay from eng ph dyrket naturengl jord natural cultivated meadows meadows Khlrot Kohlrabi Hostutbytte i alt i fOrenh. Total yield 1952 85 99 90 83 88 87 94 89 93 101 99 96 1953 102 97 101 103 103 102 100 107 107 107 97 104 1954 91 94 94 94 96 94 92 95 89 106 102 101 1955 73 83 80 67 71 75 77 84 74 81 83 79 1956 108 111 103 108 108 105 104 86 99 98 96 101 1957 85 95 87 86 88 86 80 90 91 106 104 96 1958 83 86 88 86 87 87 98 89 96 94 93 92 1959 81 81 79 70 68 76 83 94 79 97 98 87 1960 98 95 103 101 104 102 95 97 104 105 104 103 1961 105 111 103 105 104 104 98 95 107 101 99 101 Kilda : NOS XII. 54. Jordbruksstatistikk 1960 og manuskript i Byrlet. Source: NOS XII. 51. Agricultural statistics 1960 and Bureau unpublished manuscript. For tidligere hr se Statistiske Oversikter 1948, tabell 49 og tilleggsutgave 1958, tabell 38. For previous years see Statistical Survey 1948 with supplement 1958, table 38. 1 Hostutbyttet i pet. av middelsar gjelder utbyttet pr. arealenhet og blir saledes ikke phvirket av endringer 1 arealet. Som middelshrsavl betegner en den avlingsmengde en regner med a fá i jamt gode hr, nar ikke noe uforutsett stoter til. Crop yield in per cent of mean annual yield refers to output per unit of area and, therefore, is not affected by changes in total area. Mean annual yield is reckoned as a harvest in a medium good year, when there are no abnormal conditions. 2 Og overflatedyrket eng. Tabell 93. Avling i kg pr. dekar 1952--1961. Yield in kg. per decare. Kálrot Kohlrabi Hostutbytt e, i alt i fOrenh. Total yield 193 214 231 201 231 2 049 4 206 4 199 550 310 239 225 221 254 248 258 2 225 5 284 5 081 590 322 263 205 219 240 228 245 2 072 4 756 4 188 595 339 259 174 197 207 167 193 1 748 4 139 3 498 473 291 209 269 270 274 275 288 2 395 4 237 4 683 563 343 271 213 230 233 224 239 1 830 4 466 4 314 611 374 262 211 221 234 225 231 2 249 4 375 4 623 554 340 254 215 214 216 182 178 1 938 4 766 3 983 574 368 243 251 255 276 266 277 2 196 4 903 5 111 634 398 288 283 304 278 280 281 2 293 4 829 5 551 617 374 287 KlIde : Se tabell 92. Source: See table 92. For tidligere hr se Statistiske Oversikter 1948, tabell 47 og tilleggsutgave 1958, tabell 36. For previous years see Statistica Survey, table 47 with supplement 1958, table 36. 1 Og overflatedyrket eng. Tabell 94. Forbruket av kunstgjodsel i tonn verdistoff 1952-1961. Consumption of commercial fertilizers in metric tons of N, P, and K. Ar Year Kvelstoff (N) Nitrogen Fosfor (P) Phosphorus Kalium (K) Potassium Ar Year Kvelstoff (N) Nitrogen Fosfor (P) Phosphorus Kalium (K) Potassium 1952 1953 1954 1955 1956 Tonn Tonn 33 397 15 490 36 009 16 558 34 078 16 252 35 242 15 832 37 936 16 047 Tonn 37 378 1957 39 639 1958 38 826 1959 38 757 1960 41 091 1961 Tonn Tonn Tonn 43 508 17 910 44 440 42 839 17 637 41 572 46 654 18 754 43 550 48 451 19 405 45 794 47 715 19 477 44 042 ••■ • w I. a u Kilde: Se tabell 92. Source: See table 92. For tidligere hr se Statistiske Oversikter 1948, tabell 43, og tilleggsutgave 1958, tabell 32. For previous years see Statistical Survey 1948, table 43 with supplement 1958, table 32,
- Page 2 and 3:
Norges offisielle statistikk, rekke
- Page 4 and 5:
Standardtegn. Explanation of symbcl
- Page 6 and 7:
Preface The Statistical Yearbook of
- Page 8 and 9:
*8 Tabell Side 9. Hjemmehorende fol
- Page 10 and 11:
* 10 Tabell Side 64. Privat konsum
- Page 12 and 13:
*12 Tabell Side 117. Deltaking og g
- Page 14 and 15:
*14 Tabell Side 171. Registrerte sk
- Page 16 and 17:
*16 Tabell Side 226. Kommunenes bal
- Page 18 and 19:
*18 Tabell Side 277. Prisindeks for
- Page 20 and 21:
* 20 Tabell Side 328. Tilbakefall t
- Page 22 and 23:
*22 Tabell Side 395. Handelsflaten,
- Page 24 and 25:
*24 Side Driftsbygninger i jordbruk
- Page 26 and 27:
*26 Side Kaffe, forbruk 366 in.nfor
- Page 28 and 29:
*28 Side Rutebiler, busser 163-166,
- Page 30 and 31:
*30 Page unemployment 43 vocational
- Page 32 and 33:
*32 Page Investments .. 50, 52, 110
- Page 34 and 35:
*34 Page imports 127 production 83,
- Page 36 and 37:
Geografiske oppgaver m. v. 2 Geogra
- Page 38 and 39:
Geogr. og meteorol. oppgaver. 4 Geo
- Page 40 and 41:
Befolkning in. v. 6 Population etc.
- Page 42 and 43:
Befolkning m. v. 8 Population'_ etc
- Page 44 and 45:
Befolkning m. v. 10 Population etc.
- Page 46 and 47:
Befolkning m. v. 1. 2 Population et
- Page 48 and 49:
Befolkning In. v. 14 Population etc
- Page 50 and 51:
Befolkning m. v. 1 6 Population etc
- Page 52 and 53:
Folkemengdens bevegelse. 18 Vital s
- Page 54 and 55:
Befolkning m. v. 20 Population etc.
- Page 56 and 57:
Befolkning m. v. 92 Population etc.
- Page 58 and 59:
Befolkning m. v. 24 Population etc.
- Page 60 and 61:
,t O O O O 3 r■I Befolkning m. v.
- Page 62 and 63:
Befolkning m. v. 28 Population etc.
- Page 64 and 65: Befolkning m. v. 30 Population etc.
- Page 66 and 67: Befolkning og medisinalforhold. 32
- Page 68 and 69: Befolkning og medisinalforhold. 34
- Page 70 and 71: Befolkning og medisinalforhold. 36
- Page 72 and 73: Befolkning og medisinalforhold. 38
- Page 74 and 75: Arbeidsmarked. 40 Labour market. Nr
- Page 76 and 77: Arbeidsmarked. 42 Labour market. Ar
- Page 78 and 79: Arbeidsmarked. 44 Labour market. Ta
- Page 80 and 81: Arbeidsmarked. 46 Labour market. Ta
- Page 82 and 83: Arbeidsmarked. 48 Labour market. Ta
- Page 84 and 85: Nasjonalregnskap. 50 National accou
- Page 86 and 87: Nasjonalregn.skap. 52 National acco
- Page 88 and 89: Nasjonalregnskap. 54 National accou
- Page 90 and 91: Nasjonalregnskap. 56 National accou
- Page 92 and 93: Jordbruk in. v. 5 8 Agriculture etc
- Page 94 and 95: Jordbruk m. v. 60 Agriculture etc.
- Page 96 and 97: Jordbruk m. v. 62 Agriculture etc.
- Page 98 and 99: Jordbruk ill. V. 64 Agriculture etc
- Page 100 and 101: Jordbruk m. v. 66 Agriculture etc.
- Page 102 and 103: Jordbruk m. v. 68 Agriculture etc.
- Page 104 and 105: Jordbruk m. v. 70 Agriculture etc.
- Page 106 and 107: Jordbruk m. v. 72 Agriculture etc.
- Page 108 and 109: Jordbruk m. v. 74 Agriculture etc.
- Page 110 and 111: Jordbruk m. v. 76 A griculture etc.
- Page 112 and 113: Jordbruk m. v. 7 8 Agriculture etc.
- Page 116 and 117: Jordbruk m. v. 82 Agriculture etc.
- Page 118 and 119: Jordbruk. m. v. 84 Agriculture etc.
- Page 120 and 121: Jordbruk. 8 Agriculture etc, Tabz11
- Page 122 and 123: Jordbruk m. v. 88 Agriculture etc.
- Page 124 and 125: Jordbruk, skogbruk rn. v. 90 Agricu
- Page 126 and 127: Jordbruk, skogbruk m. v. 92 Agricul
- Page 128 and 129: Jor dbruk, skogbruk m. v. 94 Agricu
- Page 130 and 131: Fiske og fangst 96 Fisheries etc. T
- Page 132 and 133: Fiske og fangst. 98 Fisheries, seal
- Page 134 and 135: Fiske og fangst. Fisheries, sealing
- Page 136 and 137: Fiske og fangst. 102 Fisheries, sea
- Page 138 and 139: Fiske og fangst. 104 Fisheries. sea
- Page 140 and 141: Fiske og fangsu. 106 Fisheries, sea
- Page 142 and 143: Bergverk og industri m. v. 1OS Mini
- Page 144 and 145: Berg verk og industri in. v. 110 Mi
- Page 146 and 147: Bergverk og industri m. v. 112 Mini
- Page 148 and 149: Bergverk og industri 111. v . 114 M
- Page 150 and 151: Bergverk, industri etc. 116 Mining,
- Page 152 and 153: Bergverk og industri tn. v. 1 Minin
- Page 154 and 155: Bergverk og industri m. v. 120 Mini
- Page 156 and 157: Berg verk og industri ire, v. Minin
- Page 158 and 159: Bergverk og industri m. v. 124 Mini
- Page 160 and 161: Utenrikshandel. 1 2 6 Foreign trade
- Page 162 and 163: U tenrikshandel. 128 Foreign trade.
- Page 164 and 165:
Utenrikshandel. 130 Foreign trade.
- Page 166 and 167:
Utenrikshandel. 132 Foreign trade.
- Page 168 and 169:
Utenrikshandel. 134 Foreign trade.
- Page 170 and 171:
Utenrikshandel. 136 Foreign trade.
- Page 172 and 173:
Utenrikshandel. 138 Foreign trade.
- Page 174 and 175:
Utenrikshandel. 140 Foreign trade.
- Page 176 and 177:
Utenriksh andel. 142 Foreign trade.
- Page 178 and 179:
Utenrikshandel . 144 Foreign trade.
- Page 180 and 181:
Innenlandsk handel in. v. 146 Inter
- Page 182 and 183:
Innenlandsk halidel no. v. 148 Inte
- Page 184 and 185:
Si otransport. 150 Water transport.
- Page 186 and 187:
Sjotransport. 152 Water transport.
- Page 188 and 189:
• Sjotransport. 154 Water transpo
- Page 190 and 191:
Siotransport. 156 Water transport.
- Page 192 and 193:
Sjotransport. 15 8 W ater transport
- Page 194 and 195:
Sjotransport. 160 Water transport.
- Page 196 and 197:
Samferdsel. 162 Transport and commu
- Page 198 and 199:
Samferdsel. 164 Transport and commu
- Page 200 and 201:
Samferdsel. 1 66 Transport and comm
- Page 202 and 203:
Samferdsel. 168 Transport and commu
- Page 204 and 205:
Samferdsel. 1 7 0 Transport and com
- Page 206 and 207:
Samferdsel. 1 72 Transport and comm
- Page 208 and 209:
Sam ferdsel. 1 74 Transport and com
- Page 210 and 211:
Finanser. 76 Public finance. ••
- Page 212 and 213:
• ▪ • ▪ Finanser. 178 Publi
- Page 214 and 215:
Finanser. 180 Public finance. Tabel
- Page 216 and 217:
- - Offentlige finanser• 182 Publ
- Page 218 and 219:
Offentlige finanser. 184 Public fin
- Page 220 and 221:
- Offentlige finanser. 1 86 Public
- Page 222 and 223:
Offentlige finanser. 188 Public fin
- Page 224 and 225:
Offentlige finanser. 190 Public fin
- Page 226 and 227:
Offentlige finanser. 192 Public fin
- Page 228 and 229:
Offentlige finanser. 1 04 Public fi
- Page 230 and 231:
Offentlige finanser. 196 Public fin
- Page 232 and 233:
Offentlige finanser. 19 8 Public fi
- Page 234 and 235:
• Offentlige finanser. 200 Public
- Page 236 and 237:
Penger og kreditt. 202 Money and cr
- Page 238 and 239:
Penger og kreditt. 204 Money and cr
- Page 240 and 241:
Penger og kreditt. 206 Money and cr
- Page 242 and 243:
Penger og kreditt. 208 Money and cr
- Page 244 and 245:
Penger og kreditt. 210 Money and cr
- Page 246 and 247:
Penger og kreditt. 212 Money and cr
- Page 248 and 249:
Fenger og kreditt. 214 Money and cr
- Page 250 and 251:
Penger og kreditt. 216 Money and cr
- Page 252 and 253:
Penger og kreditt. 218 Money and cr
- Page 254 and 255:
Penger og kreditt. 220 Money and cr
- Page 256 and 257:
Penger og kreditt. 222 Money and cr
- Page 258 and 259:
Fenger og kreditt. 224 Money and cr
- Page 260 and 261:
Penger og kreditt. 220 Money and cr
- Page 262 and 263:
Penger og kreditt. 22 8 Money and c
- Page 264 and 265:
Penger og kreditt. 2 3 0 Money and
- Page 266 and 267:
Priser. Prices. 232 og maned Year a
- Page 268 and 269:
Priser. Prices. 234 Tabell 275. Pri
- Page 270 and 271:
Pricer. 236 Prices. Tahe11 279. Kon
- Page 272 and 273:
Lonninger. 238 Wages. Ar og kvartal
- Page 274 and 275:
• • Lonninger. 240 Wages. Tabel
- Page 276 and 277:
Lonninger. 242 Wages. Tabell 286. G
- Page 278 and 279:
Lonninger. 244 Wages. Tahell 2L9. M
- Page 280 and 281:
Lonninger. 24(1 Wages. Tabell 291.
- Page 282 and 283:
Sosiale forhold. 248 Social conditi
- Page 284 and 285:
Sosi ale forhold. 250 Social condit
- Page 286 and 287:
Sosiale forhold. 252 Social conditi
- Page 288 and 289:
Sosiale forhold. 254 Social conditi
- Page 290 and 291:
• • - $osiale forhold. Social c
- Page 292 and 293:
Sosiale forhold. Social conditions.
- Page 294 and 295:
Sosiale forhold. 260 Social conditi
- Page 296 and 297:
Rettsforhold. 262 Justice and crime
- Page 298 and 299:
Rettsforhold. 264 Justice and crime
- Page 300 and 301:
Rettsforhold. 266 Justice and crime
- Page 302 and 303:
Rettsforitold. 2 6 8 Justice and cr
- Page 304 and 305:
Undervisning m. v. 270 Education de
- Page 306 and 307:
Undervisning m. v. 272 Education et
- Page 308 and 309:
Undervisning m. v. 2 74 Education.
- Page 310 and 311:
Undervisning m. v. Education etc. T
- Page 312 and 313:
Under visning m. v. 97 Education et
- Page 314 and 315:
Undervisning m. v. 280 Education et
- Page 316 and 317:
Undervisning m. v. 2 8 • Educatio
- Page 318 and 319:
Undervisning m. v. 284 Education et
- Page 320 and 321:
Undervisning m. v. 2 8 6 Education
- Page 322 and 323:
• Vaig. Elections. 288 CC r. GC i
- Page 324 and 325:
V alg. Elections. 290 Nr. 2 3 4 5 6
- Page 326 and 327:
• ▪ • • • Valg. Elections
- Page 328 and 329:
Mid og vekt. 294 Measures and weigh
- Page 330 and 331:
Internasjonale oversikter. 96 Tabel
- Page 332 and 333:
Internasjonale oversikter. 298 Tabe
- Page 334 and 335:
Internasjonale oversikter. 300 Tabe
- Page 336 and 337:
Internasjonale oversikter. 302 Tabe
- Page 338 and 339:
Internasionale oversikter. 304 Tabe
- Page 340 and 341:
Internasjonale oversikter. 306 Tabe
- Page 342 and 343:
Internasjonale oversikter. 308 Tabe
- Page 344 and 345:
Internasjonale oversikter. 310 Tabe
- Page 346 and 347:
Internasjonale oversikter. 312 Nr.
- Page 348 and 349:
Internasjonale oversikter. 314 Tabe
- Page 350 and 351:
Internasjonale oversikter. 316 Tabe
- Page 352 and 353:
Internasjonale oversikter. 318 Tabe
- Page 354 and 355:
Interna3jonale oversikter. 320 Tabe
- Page 356 and 357:
Internasjonale oversikter. 39 2 Nr.
- Page 358 and 359:
, Internasjonale oversikter. 324 I
- Page 360 and 361:
Internasjonale oversikter. 326 Tabe
- Page 362 and 363:
Internasjonale oversikter. 328 Tabe
- Page 364 and 365:
Internasjonale oversikter. 330 Tabe
- Page 366 and 367:
Internasjonale oversikte r. 332 Tab
- Page 368 and 369:
Internasjonale oversikter. 334 Tabe
- Page 370 and 371:
Internasjonale oversikter. 336 Tabe
- Page 372 and 373:
Internasjonale oversikter. 338 Tabe
- Page 374 and 375:
Internasjonale oversikter. 340 Tabe
- Page 376 and 377:
Internasjonale oversikter. 342 Tabe
- Page 378 and 379:
Internasjonale oversikter. 344 Tabe
- Page 380 and 381:
Internasjonale oversikter. 346 Tabe
- Page 382 and 383:
Intemasjonale oversikter. 3 4 8 Lan
- Page 384 and 385:
Internasjonale oversikter. 350 Tabe
- Page 386 and 387:
Internasjonale oversikter. 352 Tabe
- Page 388 and 389:
Internasjonale oversikter. 354 Tabe
- Page 390 and 391:
Internasjonale oversikter. 356 Tabe
- Page 392 and 393:
Internasjonale oversikter. 358 Tabe
- Page 394 and 395:
Internasjonale oversikter. 360 Tabe
- Page 396 and 397:
Internasjonale oversikter. 362 Ar (
- Page 398 and 399:
Intemasjonale oversikter 364 Land A
- Page 400 and 401:
Tnternasjonale oversikter. 3 6 6 Ta
- Page 402 and 403:
Internasjonale oversikter. 3C8 Tabe
- Page 404 and 405:
Norges offisielle statistikk, rekke