- Page 2 and 3:
Norges offisielle statistikk, rekke
- Page 4 and 5:
Standardtegn. Explanation of symbcl
- Page 6 and 7:
Preface The Statistical Yearbook of
- Page 8 and 9:
*8 Tabell Side 9. Hjemmehorende fol
- Page 10 and 11:
* 10 Tabell Side 64. Privat konsum
- Page 12 and 13:
*12 Tabell Side 117. Deltaking og g
- Page 14 and 15:
*14 Tabell Side 171. Registrerte sk
- Page 16 and 17:
*16 Tabell Side 226. Kommunenes bal
- Page 18 and 19:
*18 Tabell Side 277. Prisindeks for
- Page 20 and 21:
* 20 Tabell Side 328. Tilbakefall t
- Page 22 and 23:
*22 Tabell Side 395. Handelsflaten,
- Page 24 and 25:
*24 Side Driftsbygninger i jordbruk
- Page 26 and 27:
*26 Side Kaffe, forbruk 366 in.nfor
- Page 28 and 29:
*28 Side Rutebiler, busser 163-166,
- Page 30 and 31:
*30 Page unemployment 43 vocational
- Page 32 and 33:
*32 Page Investments .. 50, 52, 110
- Page 34 and 35:
*34 Page imports 127 production 83,
- Page 36 and 37:
Geografiske oppgaver m. v. 2 Geogra
- Page 38 and 39:
Geogr. og meteorol. oppgaver. 4 Geo
- Page 40 and 41:
Befolkning in. v. 6 Population etc.
- Page 42 and 43:
Befolkning m. v. 8 Population'_ etc
- Page 44 and 45:
Befolkning m. v. 10 Population etc.
- Page 46 and 47:
Befolkning m. v. 1. 2 Population et
- Page 48 and 49:
Befolkning In. v. 14 Population etc
- Page 50 and 51:
Befolkning m. v. 1 6 Population etc
- Page 52 and 53:
Folkemengdens bevegelse. 18 Vital s
- Page 54 and 55:
Befolkning m. v. 20 Population etc.
- Page 56 and 57:
Befolkning m. v. 92 Population etc.
- Page 58 and 59:
Befolkning m. v. 24 Population etc.
- Page 60 and 61:
,t O O O O 3 r■I Befolkning m. v.
- Page 62 and 63:
Befolkning m. v. 28 Population etc.
- Page 64 and 65:
Befolkning m. v. 30 Population etc.
- Page 66 and 67:
Befolkning og medisinalforhold. 32
- Page 68 and 69: Befolkning og medisinalforhold. 34
- Page 70 and 71: Befolkning og medisinalforhold. 36
- Page 72 and 73: Befolkning og medisinalforhold. 38
- Page 74 and 75: Arbeidsmarked. 40 Labour market. Nr
- Page 76 and 77: Arbeidsmarked. 42 Labour market. Ar
- Page 78 and 79: Arbeidsmarked. 44 Labour market. Ta
- Page 80 and 81: Arbeidsmarked. 46 Labour market. Ta
- Page 82 and 83: Arbeidsmarked. 48 Labour market. Ta
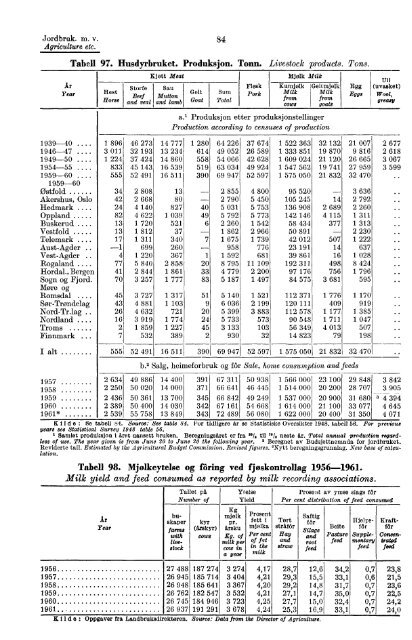
- Page 84 and 85: Nasjonalregnskap. 50 National accou
- Page 86 and 87: Nasjonalregn.skap. 52 National acco
- Page 88 and 89: Nasjonalregnskap. 54 National accou
- Page 90 and 91: Nasjonalregnskap. 56 National accou
- Page 92 and 93: Jordbruk in. v. 5 8 Agriculture etc
- Page 94 and 95: Jordbruk m. v. 60 Agriculture etc.
- Page 96 and 97: Jordbruk m. v. 62 Agriculture etc.
- Page 98 and 99: Jordbruk ill. V. 64 Agriculture etc
- Page 100 and 101: Jordbruk m. v. 66 Agriculture etc.
- Page 102 and 103: Jordbruk m. v. 68 Agriculture etc.
- Page 104 and 105: Jordbruk m. v. 70 Agriculture etc.
- Page 106 and 107: Jordbruk m. v. 72 Agriculture etc.
- Page 108 and 109: Jordbruk m. v. 74 Agriculture etc.
- Page 110 and 111: Jordbruk m. v. 76 A griculture etc.
- Page 112 and 113: Jordbruk m. v. 7 8 Agriculture etc.
- Page 114 and 115: Jordbruk m. v. 80 Agriculture etc.
- Page 116 and 117: Jordbruk m. v. 82 Agriculture etc.
- Page 120 and 121: Jordbruk. 8 Agriculture etc, Tabz11
- Page 122 and 123: Jordbruk m. v. 88 Agriculture etc.
- Page 124 and 125: Jordbruk, skogbruk rn. v. 90 Agricu
- Page 126 and 127: Jordbruk, skogbruk m. v. 92 Agricul
- Page 128 and 129: Jor dbruk, skogbruk m. v. 94 Agricu
- Page 130 and 131: Fiske og fangst 96 Fisheries etc. T
- Page 132 and 133: Fiske og fangst. 98 Fisheries, seal
- Page 134 and 135: Fiske og fangst. Fisheries, sealing
- Page 136 and 137: Fiske og fangst. 102 Fisheries, sea
- Page 138 and 139: Fiske og fangst. 104 Fisheries. sea
- Page 140 and 141: Fiske og fangsu. 106 Fisheries, sea
- Page 142 and 143: Bergverk og industri m. v. 1OS Mini
- Page 144 and 145: Berg verk og industri in. v. 110 Mi
- Page 146 and 147: Bergverk og industri m. v. 112 Mini
- Page 148 and 149: Bergverk og industri 111. v . 114 M
- Page 150 and 151: Bergverk, industri etc. 116 Mining,
- Page 152 and 153: Bergverk og industri tn. v. 1 Minin
- Page 154 and 155: Bergverk og industri m. v. 120 Mini
- Page 156 and 157: Berg verk og industri ire, v. Minin
- Page 158 and 159: Bergverk og industri m. v. 124 Mini
- Page 160 and 161: Utenrikshandel. 1 2 6 Foreign trade
- Page 162 and 163: U tenrikshandel. 128 Foreign trade.
- Page 164 and 165: Utenrikshandel. 130 Foreign trade.
- Page 166 and 167: Utenrikshandel. 132 Foreign trade.
- Page 168 and 169:
Utenrikshandel. 134 Foreign trade.
- Page 170 and 171:
Utenrikshandel. 136 Foreign trade.
- Page 172 and 173:
Utenrikshandel. 138 Foreign trade.
- Page 174 and 175:
Utenrikshandel. 140 Foreign trade.
- Page 176 and 177:
Utenriksh andel. 142 Foreign trade.
- Page 178 and 179:
Utenrikshandel . 144 Foreign trade.
- Page 180 and 181:
Innenlandsk handel in. v. 146 Inter
- Page 182 and 183:
Innenlandsk halidel no. v. 148 Inte
- Page 184 and 185:
Si otransport. 150 Water transport.
- Page 186 and 187:
Sjotransport. 152 Water transport.
- Page 188 and 189:
• Sjotransport. 154 Water transpo
- Page 190 and 191:
Siotransport. 156 Water transport.
- Page 192 and 193:
Sjotransport. 15 8 W ater transport
- Page 194 and 195:
Sjotransport. 160 Water transport.
- Page 196 and 197:
Samferdsel. 162 Transport and commu
- Page 198 and 199:
Samferdsel. 164 Transport and commu
- Page 200 and 201:
Samferdsel. 1 66 Transport and comm
- Page 202 and 203:
Samferdsel. 168 Transport and commu
- Page 204 and 205:
Samferdsel. 1 7 0 Transport and com
- Page 206 and 207:
Samferdsel. 1 72 Transport and comm
- Page 208 and 209:
Sam ferdsel. 1 74 Transport and com
- Page 210 and 211:
Finanser. 76 Public finance. ••
- Page 212 and 213:
• ▪ • ▪ Finanser. 178 Publi
- Page 214 and 215:
Finanser. 180 Public finance. Tabel
- Page 216 and 217:
- - Offentlige finanser• 182 Publ
- Page 218 and 219:
Offentlige finanser. 184 Public fin
- Page 220 and 221:
- Offentlige finanser. 1 86 Public
- Page 222 and 223:
Offentlige finanser. 188 Public fin
- Page 224 and 225:
Offentlige finanser. 190 Public fin
- Page 226 and 227:
Offentlige finanser. 192 Public fin
- Page 228 and 229:
Offentlige finanser. 1 04 Public fi
- Page 230 and 231:
Offentlige finanser. 196 Public fin
- Page 232 and 233:
Offentlige finanser. 19 8 Public fi
- Page 234 and 235:
• Offentlige finanser. 200 Public
- Page 236 and 237:
Penger og kreditt. 202 Money and cr
- Page 238 and 239:
Penger og kreditt. 204 Money and cr
- Page 240 and 241:
Penger og kreditt. 206 Money and cr
- Page 242 and 243:
Penger og kreditt. 208 Money and cr
- Page 244 and 245:
Penger og kreditt. 210 Money and cr
- Page 246 and 247:
Penger og kreditt. 212 Money and cr
- Page 248 and 249:
Fenger og kreditt. 214 Money and cr
- Page 250 and 251:
Penger og kreditt. 216 Money and cr
- Page 252 and 253:
Penger og kreditt. 218 Money and cr
- Page 254 and 255:
Penger og kreditt. 220 Money and cr
- Page 256 and 257:
Penger og kreditt. 222 Money and cr
- Page 258 and 259:
Fenger og kreditt. 224 Money and cr
- Page 260 and 261:
Penger og kreditt. 220 Money and cr
- Page 262 and 263:
Penger og kreditt. 22 8 Money and c
- Page 264 and 265:
Penger og kreditt. 2 3 0 Money and
- Page 266 and 267:
Priser. Prices. 232 og maned Year a
- Page 268 and 269:
Priser. Prices. 234 Tabell 275. Pri
- Page 270 and 271:
Pricer. 236 Prices. Tahe11 279. Kon
- Page 272 and 273:
Lonninger. 238 Wages. Ar og kvartal
- Page 274 and 275:
• • Lonninger. 240 Wages. Tabel
- Page 276 and 277:
Lonninger. 242 Wages. Tabell 286. G
- Page 278 and 279:
Lonninger. 244 Wages. Tahell 2L9. M
- Page 280 and 281:
Lonninger. 24(1 Wages. Tabell 291.
- Page 282 and 283:
Sosiale forhold. 248 Social conditi
- Page 284 and 285:
Sosi ale forhold. 250 Social condit
- Page 286 and 287:
Sosiale forhold. 252 Social conditi
- Page 288 and 289:
Sosiale forhold. 254 Social conditi
- Page 290 and 291:
• • - $osiale forhold. Social c
- Page 292 and 293:
Sosiale forhold. Social conditions.
- Page 294 and 295:
Sosiale forhold. 260 Social conditi
- Page 296 and 297:
Rettsforhold. 262 Justice and crime
- Page 298 and 299:
Rettsforhold. 264 Justice and crime
- Page 300 and 301:
Rettsforhold. 266 Justice and crime
- Page 302 and 303:
Rettsforitold. 2 6 8 Justice and cr
- Page 304 and 305:
Undervisning m. v. 270 Education de
- Page 306 and 307:
Undervisning m. v. 272 Education et
- Page 308 and 309:
Undervisning m. v. 2 74 Education.
- Page 310 and 311:
Undervisning m. v. Education etc. T
- Page 312 and 313:
Under visning m. v. 97 Education et
- Page 314 and 315:
Undervisning m. v. 280 Education et
- Page 316 and 317:
Undervisning m. v. 2 8 • Educatio
- Page 318 and 319:
Undervisning m. v. 284 Education et
- Page 320 and 321:
Undervisning m. v. 2 8 6 Education
- Page 322 and 323:
• Vaig. Elections. 288 CC r. GC i
- Page 324 and 325:
V alg. Elections. 290 Nr. 2 3 4 5 6
- Page 326 and 327:
• ▪ • • • Valg. Elections
- Page 328 and 329:
Mid og vekt. 294 Measures and weigh
- Page 330 and 331:
Internasjonale oversikter. 96 Tabel
- Page 332 and 333:
Internasjonale oversikter. 298 Tabe
- Page 334 and 335:
Internasjonale oversikter. 300 Tabe
- Page 336 and 337:
Internasjonale oversikter. 302 Tabe
- Page 338 and 339:
Internasionale oversikter. 304 Tabe
- Page 340 and 341:
Internasjonale oversikter. 306 Tabe
- Page 342 and 343:
Internasjonale oversikter. 308 Tabe
- Page 344 and 345:
Internasjonale oversikter. 310 Tabe
- Page 346 and 347:
Internasjonale oversikter. 312 Nr.
- Page 348 and 349:
Internasjonale oversikter. 314 Tabe
- Page 350 and 351:
Internasjonale oversikter. 316 Tabe
- Page 352 and 353:
Internasjonale oversikter. 318 Tabe
- Page 354 and 355:
Interna3jonale oversikter. 320 Tabe
- Page 356 and 357:
Internasjonale oversikter. 39 2 Nr.
- Page 358 and 359:
, Internasjonale oversikter. 324 I
- Page 360 and 361:
Internasjonale oversikter. 326 Tabe
- Page 362 and 363:
Internasjonale oversikter. 328 Tabe
- Page 364 and 365:
Internasjonale oversikter. 330 Tabe
- Page 366 and 367:
Internasjonale oversikte r. 332 Tab
- Page 368 and 369:
Internasjonale oversikter. 334 Tabe
- Page 370 and 371:
Internasjonale oversikter. 336 Tabe
- Page 372 and 373:
Internasjonale oversikter. 338 Tabe
- Page 374 and 375:
Internasjonale oversikter. 340 Tabe
- Page 376 and 377:
Internasjonale oversikter. 342 Tabe
- Page 378 and 379:
Internasjonale oversikter. 344 Tabe
- Page 380 and 381:
Internasjonale oversikter. 346 Tabe
- Page 382 and 383:
Intemasjonale oversikter. 3 4 8 Lan
- Page 384 and 385:
Internasjonale oversikter. 350 Tabe
- Page 386 and 387:
Internasjonale oversikter. 352 Tabe
- Page 388 and 389:
Internasjonale oversikter. 354 Tabe
- Page 390 and 391:
Internasjonale oversikter. 356 Tabe
- Page 392 and 393:
Internasjonale oversikter. 358 Tabe
- Page 394 and 395:
Internasjonale oversikter. 360 Tabe
- Page 396 and 397:
Internasjonale oversikter. 362 Ar (
- Page 398 and 399:
Intemasjonale oversikter 364 Land A
- Page 400 and 401:
Tnternasjonale oversikter. 3 6 6 Ta
- Page 402 and 403:
Internasjonale oversikter. 3C8 Tabe
- Page 404 and 405:
Norges offisielle statistikk, rekke