- Page 2 and 3:
Nr. 32 Økonomisk utsyn over året
- Page 6 and 7:
NORGES OFFISIELLE STATISTIKK XII S2
- Page 8 and 9:
Forord Statistisk årbok inneholder
- Page 10 and 11:
*7 Innhold. Contents. Kapitler: Cha
- Page 12 and 13:
*9 Tabell Side 33. Kremasjoner 1958
- Page 14 and 15:
*1 1 Tabell Side 84. Førstegangsko
- Page 16 and 17:
*13 Tabell Side 134. Månedlig prod
- Page 18 and 19:
*15 Tabell Side 1 90. Hotellstatist
- Page 20 and 21:
*17 Tabell Side 244. Alderstrygd og
- Page 22 and 23:
*19 Tabell Side 292. Medlemstallet
- Page 24 and 25:
*21 Tabell Side 344. Kinematografer
- Page 26 and 27:
* 23 Side Administrative delinger .
- Page 28 and 29:
*25 Side Fôr, se grønn-, kraft-,
- Page 30 and 31:
*27 Side pensjoner, trygder 213 tje
- Page 32 and 33:
*29 Side Rovviltpremier 98 Rug, are
- Page 34 and 35:
*31 Side Ved, avvirking 95 priser 2
- Page 36 and 37:
*33 Page Fiction, works of 279 Fina
- Page 38 and 39:
*35 Page Savings Bank, Postal .. .
- Page 40 and 41:
1 Geografiske opplysninger. Geograp
- Page 42 and 43:
3 Meteorologiske forhold. Climate.
- Page 44 and 45:
5 Befolkning. Population. Tabell 4.
- Page 46 and 47:
Befoikning. Population. Tabell 7. H
- Page 48 and 49:
Rogaland Eidfjord (forts.) Madla 2
- Page 50 and 51:
Befolkning. Population. Tabell 7 (f
- Page 52 and 53:
Alder Age 13 Befolkning. Population
- Page 54 and 55:
15 Befolkning. Population. Tabell 1
- Page 57 and 58:
1 7 Befolkning. Population. Tabell
- Page 59 and 60:
19 Befolkning. Population. Tabell 1
- Page 62 and 63:
21 Befolkning. Population. Tabell 1
- Page 64 and 65:
23 Befolkning. Population. Tabell 1
- Page 66 and 67:
Årlig gjennomsnitt Annual average
- Page 68 and 69:
27 Folkemengdens bevegelse. Vital s
- Page 70 and 71:
29 Folkemengdens bevegelse. Vital s
- Page 72 and 73:
• 31 Folkemengdens bevegelse. Vit
- Page 74:
Tabell 34. Døde pr. 10 000 innbygg
- Page 77 and 78:
35 Folkemengdens bevegelse. Vital s
- Page 79 and 80:
Innflyttet fra, utflyttet til bygde
- Page 81 and 82:
39 Sunnhetstilstand, dødsårsaker.
- Page 83 and 84:
41 Sunnhetstilstand, dødsårsaker.
- Page 85 and 86:
Deaths in 1959 by age and causes of
- Page 87 and 88:
45 Sunnhetstilstand, dødsårsaker.
- Page 89 and 90:
47 Jordbruk. Agriculture etc. Tabel
- Page 91 and 92:
Dekar. Jordbrukstellingen 20. juni
- Page 93 and 94:
51 Jordbruk. Agriculture etc. vekst
- Page 95 and 96:
53 Jordbruk. Agriculture etc. og b
- Page 97 and 98:
55 Jordbruk. Agriculture etc. Tabel
- Page 99 and 100:
uksstorrelse. jordbrukstellingen 20
- Page 101 and 102:
fylker og bruksstørrelse. Jordbruk
- Page 103 and 104:
og bruksstørrelse. Jordbrukstellin
- Page 105 and 106:
og bruksstørrelse. Jordbrukstellin
- Page 107 and 108:
65 Jordbruk. Agriculture etc. maski
- Page 109 and 110:
etter fylker og bruksstørrelse. Jo
- Page 111 and 112:
69 Jordbruk. Agriculture etc. Tabel
- Page 113 and 114:
71 Jordbruk. Agriculture etc. fylke
- Page 115 and 116:
73 Jordbruk. Agriculture etc. Lives
- Page 117 and 118:
75 Jordbruk. Agriculture etc. Tabel
- Page 119 and 120:
Ar Year 1952 1953 1954 1955 1956 19
- Page 121 and 122:
79 Jordbruk. Agriculture etc. Tabel
- Page 123 and 124:
81 Jordbruk. Agriculture etc. Tabel
- Page 125 and 126:
83 Jordbruk. Agriculture etc. Tabel
- Page 128 and 129:
85 Jordbruk. Agriculture etc. I alt
- Page 131 and 132:
Riket The whole country. 1957 1958
- Page 133:
Tabell 93. Skogarealet etter fylker
- Page 136 and 137:
91 Skogbruk. Forestry. Tabell 95. S
- Page 138 and 139:
93 Skogbruk. Forestry. Tabell 98. P
- Page 140 and 141:
95 Skogbruk. Forestry. Tabell 100 (
- Page 142 and 143:
Anlegg Roads Ferdig Ferdig Utgifter
- Page 144 and 145:
År Year 9 9 Fiske, sel- og hvalfan
- Page 146 and 147:
101 Fiske, sel- og hvalfangst. Fish
- Page 148 and 149:
103 Fiske, sel- og hvalfangst. Fish
- Page 150 and 151:
1 05 Fiske, sel- og hvalfangst. Fis
- Page 152 and 153:
Nordfeltene: Northern grounds: Sels
- Page 154 and 155:
109 Bedriftstelling. Census of esta
- Page 156 and 157:
Næring Industry gran, Merkantil tj
- Page 158 and 159:
113 Bergverk og industri. Mining an
- Page 160 and 161:
Fordeling etter grupper 1959. Stør
- Page 162 and 163:
1 17 Bergverk og industri. Mining a
- Page 164 and 165:
Produkter Products Produkter av ikk
- Page 166 and 167:
1 21 Bergverk og industri. Mining a
- Page 168 and 169:
23 Bergverk og industri. Mining and
- Page 170:
Fylker Counties I alt Total 1953
- Page 173 and 174:
1 27 Bergverk og industri. Mining a
- Page 175 and 176:
1955 1956 1957 1958 1959 1960* År
- Page 177 and 178:
131 Utenrikshandel. Foreign trade.
- Page 179 and 180:
Varesorter Commodities 133 Utenriks
- Page 181 and 182:
1 35 Utenrikshandel. Foreign trade.
- Page 183 and 184:
137 Utenrikshandel. Foreign trade.
- Page 185 and 186:
139 Utenrikshandel. Foreign trade.
- Page 187 and 188:
141 Utenrikshandel. Foreign trade.
- Page 189 and 190:
1 43 Utenrikshandel. Foreign trade.
- Page 191 and 192:
145 Utenrikshandel. Foreign trade.
- Page 193 and 194:
147 Utenrikshandel. Foreign trade.
- Page 195 and 196:
149 Innenlandsk handel etc. Interna
- Page 197 and 198:
Næring Industry group Varegrupper
- Page 199 and 200:
1 53 Sjøtransport. Water transport
- Page 201 and 202:
Aldersgrupper Age of vessel Under 5
- Page 203 and 204:
1. nov. 1958 1. nov. 1959 I innenri
- Page 205 and 206:
159 Sjøtransport. Water transport.
- Page 207 and 208:
161 Samferdsel. Transport and commu
- Page 209 and 210:
1 63 Samferdsel. Transport and comm
- Page 211 and 212:
165 Samferdsel. Transport and commu
- Page 213 and 214:
År Year Fylker Counties I alt Tota
- Page 215 and 216:
Ar og måned Year and month I alt T
- Page 217 and 218:
Fly med over 2 tonn maks. tillatt s
- Page 219 and 220:
Selskaper Number of companies Telef
- Page 221 and 222:
De viktigste byer Principal towns O
- Page 223 and 224:
1 77 Kredittmarked m.v. Credit mark
- Page 225 and 226:
79 Kredittmarked m.v. Credit market
- Page 227 and 228:
1 81 Kredittmarked m.v. Credit mark
- Page 229 and 230:
1 83 Kredittmarkedm.v. Credit marke
- Page 231 and 232:
1 85 Kredittmarked m. v. Credit mar
- Page 233 and 234:
1 8 7 Kredittmarked m. v. Credit ma
- Page 235 and 236:
189 Kredittmarked m. v. Credit mark
- Page 237 and 238:
Aktiva og passiva Assets and liabil
- Page 239 and 240:
59 61 61 61 96 99 97 95 Mill. kr. M
- Page 241 and 242:
Aktiva og passiva Assets and liabil
- Page 243 and 244:
197 Kredittmarked m.v Credit market
- Page 245 and 246:
Nominel relite Nominal interest ute
- Page 247 and 248:
1 År og måned Year and month 1953
- Page 249 and 250:
203 Kredittmarked m.v. Credit marke
- Page 251 and 252:
205 Sosial trygd og forsorg. Social
- Page 253 and 254:
1955 1956 1957 82 Forsikrede bedrif
- Page 255 and 256:
209 Sosial trygd og forsorg. Social
- Page 257 and 258:
211 Sosial trygd og forsorg. Social
- Page 259 and 260:
Fylker Counties 213 Sosial trygd og
- Page 261 and 262:
100 100 100 106 109 110 111 111 109
- Page 263 and 264:
1955 1956 1957 1958 1959 1960 Ar Ye
- Page 265 and 266:
219 Priser m. v. Prices etc. Tabell
- Page 267 and 268:
22 1 Priser, forbruksundersøkelse.
- Page 269 and 270:
2 2 3 Priser, forbruksundersøkelse
- Page 271 and 272:
225 Priser, forbruksundersøkelse.
- Page 273 and 274:
227 Priser, forbruksundersøkelse.
- Page 275 and 276:
År og måned Year and month 1954 1
- Page 277 and 278:
231 Arbeidsmarked, lønninger m. v.
- Page 279 and 280:
233 Arbeidsmarked, lønninger m. v.
- Page 281 and 282:
År og kvartal Year and quarter To-
- Page 283 and 284:
237 Arbeidsmarked, lønninger m. v.
- Page 285 and 286:
239 Arbeidsmarked, lønninger m. v.
- Page 287 and 288:
241 Arbeidsmarked, lønninger m. v.
- Page 289 and 290:
243 Arbeidsmarked, lønninger m. v.
- Page 291 and 292:
Etat og stilling Service and occupa
- Page 293 and 294:
247 Arbeidsmarked, lønninger m. v.
- Page 295 and 296:
249 Arbeidsmarked, lønninger m. v.
- Page 297 and 298:
25 1 Arbeidsmarked, lønninger m. v
- Page 299 and 300:
Brennevin og vin Spirits and wines
- Page 301 and 302:
255 Alkoholforbruk m. v. Alcoholic
- Page 303 and 304:
257 Rettsvesen. Justice and crime.
- Page 305 and 306:
Forbrytelsens art Type of offence 1
- Page 307 and 308:
261 Rettsvesen. Justice and crime.
- Page 309 and 310: 1954 1955 1956 1957 t958 1959 1960
- Page 311 and 312: 11 . 1 32 .. Barneskoler Lower stag
- Page 313 and 314: Folkeskole Public primary school 26
- Page 315 and 316: 269 Undervisning. Education. Tabell
- Page 317 and 318: Fylker Counties Kombinert realskole
- Page 319 and 320: 273 Undervisning. Education. Tabell
- Page 321 and 322: 275 Undervisning m. v. Education et
- Page 323 and 324: Bind 31/12 1960 Stock of volumes 29
- Page 325 and 326: Ar Year 1955 1956 1957 1958 1959 Av
- Page 327 and 328: Registrerte lisenser I Registered l
- Page 329 and 330: statstjenesten, folkeskolen og kirk
- Page 331 and 332: I 1954 I. Kommuneskattelikningen Mu
- Page 333 and 334: 287 Finanser. Public finance. Tabel
- Page 335 and 336: Inntektstrinn Income groups 4. Skat
- Page 337 and 338: 291 Finanser. Public finance. Tabel
- Page 339 and 340: 293 Finanser. Public finance. Tabel
- Page 341 and 342: 295 Finanser. Public finance. Tabel
- Page 343 and 344: 297 Finanser. Public finance. Tabel
- Page 345 and 346: 299 Finanser. Public finance. Tabel
- Page 347 and 348: 301 Finanser. Public finance. 1957-
- Page 349 and 350: Etter valutakurse 303 Finanser. Pub
- Page 351 and 352: 305 Finanser. Public finance. samle
- Page 353 and 354: 307 Lånegjeld (utad) Debt Fylker C
- Page 355 and 356: 309 Finanser. Public finance. utgif
- Page 357 and 358: 311 Nasjonalregnskap. National acco
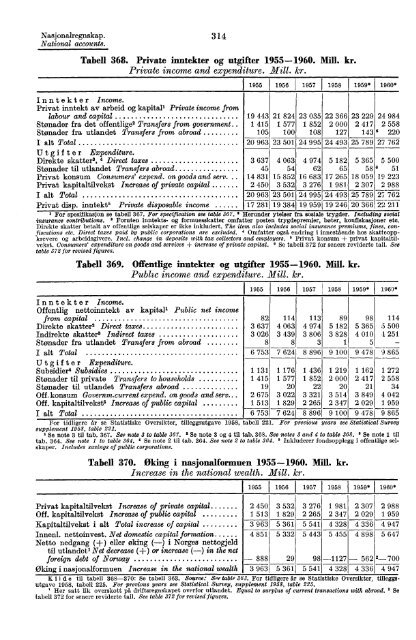
- Page 359: 313 Nasjonalregnskap. National acco
- Page 363 and 364: 1955-1960. Mill. kr. Balance of pay
- Page 366: Tabell 374. Stortingsvalgene 1945,
- Page 369 and 370: 321 Valg. Elections. og 1959. Stemm
- Page 372 and 373: 323 Svalbard. Svalbard. Luftens I N
- Page 374 and 375: 3 25 Internasjonale oversikter. INT
- Page 376 and 377: 327 Internasjonale oversikter. Tabe
- Page 378 and 379: 32 9 Internasjonale oversikter. Tab
- Page 380 and 381: 331 Internasjonale oversikter. Folk
- Page 382 and 383: 333 Internasjonale overiikter. Tabe
- Page 384 and 385: 33 5 Internasjonale oversikter. Tab
- Page 386 and 387: 337 Internasjonale oversikter. Tabe
- Page 388 and 389: 339 Internasjonale oversikter. ette
- Page 390 and 391: 341 Internasjonale oversikter. Tabe
- Page 392 and 393: 343 Internasjonale oversikter. Tabe
- Page 394 and 395: i de enkelte aldersgrupper. 1,6 2,7
- Page 396 and 397: i de enkelte aldersgrupper. 35-39
- Page 398 and 399: 349 Internasjonale oversikter. innb
- Page 400 and 401: 35 1 Internasjonale oversikter. hos
- Page 402 and 403: 353 Internasjonale oversikter. Land
- Page 404 and 405: 355 Internasjonale oversikter. Tabe
- Page 406 and 407: 357 Internasjonale oversikter. Tabe
- Page 408 and 409: 359 Internasjonale oversikter. Tabe
- Page 410 and 411:
3 61 Internasjonale oversikter. Tab
- Page 412 and 413:
3 63 Internasjonale oversikter. Tab
- Page 414 and 415:
365 Internasjonale oversikter. Tabe
- Page 416 and 417:
367 Internasjonale oversikter. Tabe
- Page 418 and 419:
369 Internasjonale oversikter lands
- Page 420 and 421:
37 1 Internasjonale oversikter. Tab
- Page 422 and 423:
373 Internasjonale oversikter. Tabe
- Page 424 and 425:
375 Internasjonale oversiii ter. Ta
- Page 426 and 427:
37 7 Internasjonale oversikter. Lan
- Page 428 and 429:
3 79 Internasjonale oversikter. Tab
- Page 430 and 431:
38 1 Internasjonale oversikter. Lan
- Page 432 and 433:
38 3 Internasjonale oversikter. Tab
- Page 434 and 435:
385 Internasjonale oversikter. Tabe
- Page 436 and 437:
387 Internasjonale oversikter. Tabe
- Page 438 and 439:
3 8 9 Internasjonale oversikter. Å
- Page 440 and 441:
391 Internasjonale over 3 ikter Ar
- Page 442 and 443:
3 9 3 Internasjonale oversikter. La
- Page 444 and 445:
395 Internasjonale oversikter. Norg
- Page 446 and 447:
3 97 Internasjonale oversikter. Lan
- Page 448 and 449:
39 9 Internasjonale oversikter. Lan
- Page 450 and 451:
401 Internasjonale oversikter. Tabe
- Page 452 and 453:
Norges offisielle statistikk, rekke