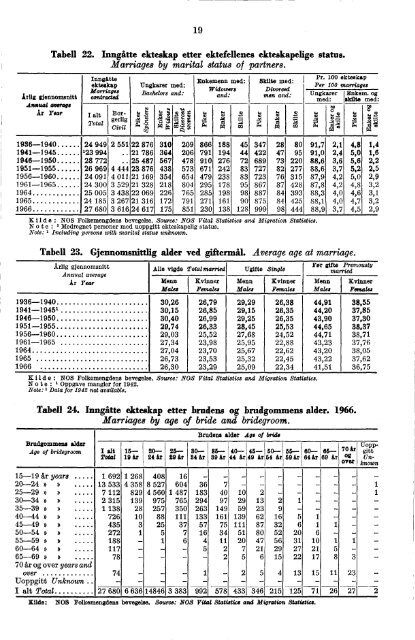
19 Tabell 22. hmgfitte ekteskap etter ektefellenes ekteskapelige status. Marriages by marital status of partners. Inngitte Pr. 100 ekteskap Enkemenn med: Skilte med: ekteakap Ungkarer med: Per 100 marriages Marriages Widowers Divorced Bl Bachelors and: Arlig gjennomsnitt contracted and: men and: Ungkarer Enkem. og med: Atha med: Annual average I to Ar Year Z . I alt Bor. t .2 t g S tt 0 ọ t e t tj -S t cti) -413 ti .8 2 t . 2 g e r 1 i g ,4 :i 1 :ta :.ti E :?'1 Total . , 1 -3' r. ' :1 7;14 Civil g'' *Pi PA co ,... § 4, W w c:‘, pq co : A., 4 ,.0.7-1 0 1 :4 ,,,, :4 . A PA IA 1936-1940 24 949 2 551 22 876 310 209 866 188 45 347 28 80 91,7 2,1 4,8 1,4 1941-1945 123 994 .. 21 786 364 206 791 194 44 422 47 95 91,0 2,4 5,0 1,6 1946-1950 28 772 .. 25 487 567 478 910 276 72 689 73 220 88,6 3,6 5,6 2,2 1951-1955 26 969 4 444 23 876 438 573 671 242 83 727 82 277 88,6 3,7 5,2 2,5 1956-1960 24 091 4 011 21 169 354 654 479 238 83 723 76 315 87,9 4,2 5,0 2,9 1961-1965 24 300 3 529 21 328 218 804 295 178 95 867 87 428 87,8 4,2 4,8 3,2 1964 25 005 3 438 22 069 226 765 285 198 98 887 84 393 88,3 4,0 4,6 3,1 1965 24 185 3 267 21 316 172 791 271 161 90 875 84 425 88,1 4,0 4,7 3,2 1966 27 68() 3 616 24 617 175 851 230 138 128 999 98 444 88,9 3,7 4,5 2,9 Kilde : NOS Folkemengdens bevegelse. Source: NOS Vital Statistics and Migration Statistics. Note : 1 Medregnet personer med uoppgitt ekteskapelig status. Note:. Including persons with marital status unknown. Tabell 23. Gjennomsnittlig alder ved giftermill. Average age at marriage. Arlig gjennomsnitt Annual average Ar Year Alle vigde Total married Menu Males Kvinner Females Uglfte Single Mean Males Kvinner Females Far gifts Previously married Mann Males Kvinner Females 1936-1940 30,26 26,79 29,29 26,38 44,91 38,55 1941_1945 1 30,15 26,85 29,15 26,35 44,20 37,85 1946-1950 30,40 26,99 29,25 26,35 43,90 37,30 1951-1955 29,74 26,33 28,45 25,53 44,65 38,37 1956-1960 29,03 25,52 27,68 24,52 44,71 38,71 1961-1965 27,34 23,98 25,95 22,88 43,23 37,76 1964 27,04 23,70 25,67 22,62 43,20 38,05 1965 26,73 23,53 25,32 22,45 43,22 37,62 1966 26,30 23,29 25,09 22,34 41,51 36,75 Kilde: NOS Folkemengdens bevegelse. Source: NOS Vital Statistics and Migration Statistics. Note : 1 Oppgave mangler for 1942. Note: 1 Data for 1942 not available. Tabell 24. Inngatte ekteskap etter brudens og brudgommens alder. 1966. Marriages by age of bride and bridegroom. BrIlagOMmens &Mr Age of bridegroom I alt Total 15- 19 ir 20- 24 la 25.- 29 ir 30- 34 ar Brudens alder Age of bride 85- 89 kr 44 40- it 49 45- la 54 50- ir 59 55- Ar 64 60- ar 69 65- lir 70 ._ ar og over U opp - gitt Unknown 15-19 to years 1 692 1 268 408 16 - - - -- - 20-24 » a 13 533 4 358 8 527 604 36 7 - - - - - - - 1 25-29 e a 7 112 829 4 560 1 487 183 40 10 2 - -- 1 30-34 a * 2 315 139 975 765 294 97 29 13 2 1 - - - 35-39 » » 1 138 28 257 350 263 149 59 23 9 - - - - - 40-44 a a 726 10 88 111 133 161 139 62 16 5 1 - - - 45-49 a a 435 3 25 37 57 75 111 87 32 6 1 1 - - 50---54 » a 272 1 5 7 16 34 51 80 52 20 6 - - 55-59 a a 188 - 1 6 4 11 20 47 56 31 10 1 1 - 60-64 a a 117 - - 5 2 7 21 29 27 21 5 - - 65-69 a a 78 - - - - 2 5 6 15 22 17 8 3 - 70 ár og over years and over 74 - - - 1 - 2 5 4 13 15 11 23 - Uoppgitt Unknown - - - - - - - - - - - - - I alt Total 27 680 6 636 14846 3 383 992 578 433 346 215 125 71 26 27 2 Kilde: NOS Folkemengdens bevegelse. Source: NOS Vital Statistics and Migration Statistics.
20 Tabell 25. Giftermilshyppighet for ugifte etter kjonn og alder. Marriage rates for single persons by sex and age. Vigde pr. 1000 av middelfolkemengden Persons married per 1000 mean population Uoppgitt Unknoum Alder Age Menn Males Kvinner Females 1919- 1929- 1945- 1949- 11955- 11959- 1922 1932 1948 19521 19561 1962 1919- 1922 1929- 1932 1945- 1949- 11955- 1959- 1948 19521 1956 1962 15-19 ar years 1,0 0,7 1,5 2,7 4,2 7,3 9,8 7,6 15,3 23,0 33,4 38,8 20-24 # # 45,1 30,2 44,1 57,0 79,1 101,3 79,8 67,0 108,1 146,6 193,1 217,0 25-29 » * 115,2 94,6 125,0 139,6 154,1 168,1 98,9 96,0 162,5 178,7 197,3 203,0 30-34 # # 105,9 101,3 132,9 128,5 118,4 107,0 60,4 61,4 111,3 110,3 107,3 99,7 35-39 * * 70,0 67,3 91,4 81,0 69,8 58,1 31,4 29,3 57,8 55,0 53,7 49,5 40-44 * * 39,7 38,3 55,3 46,8 38,5 32,8 16,9 15,6 29,1 27,4 27,5 24,8 45-49 » * 23,2 22,1 31,9 27,0 21,5 17,3 9,7 8,8 14,0 14,1 14,9 13,1 50-54 * * 12,1 12,2 18,1 14,6 13,6 9,6 4,5 4,4 7,1 6,4 7,5 7,3 55-59 * * 6,8 6,7 9,0 8,6 7,3 5,7 1,9 1,6 2,5 3,1 3,3 3,3 60-64 » * 3,3 3,8 4,1 3,8 3,5 2,7 0,5 0,6 0,8 1,1 1,3 1,9 65-69 * * 1,1 1,4 2,1 1,9 1,6 2,0 0,3 0,5 0,6 0,5 0,7 0,7 70-74 # * 0,4 0,6 0,8 0,7 1,2 1,1 0,1 0,2 0,3 0,3 0,4 0,2 75 fir og over and over 15 ar og over 0,1 0,1 0,5 0,2 0,2 0,6 0,1 - 0,1 0,1 0,1 and over 41,9 38,0 55,2 58,6 58,1 53,5 41,1 37,9 60,0 65,2 66,3 63,0 Kilda : NOS Folkemengdens bevegelse. Source: NOS Vital Statistics and Migration Statistics. Ar Year Tabell 26. Skilsmisser og separasjoner. Divorces and separations. Skilsmisser alt Divorces, total Barn i alt Children, total Separasjoner Separations Skilsmisser etter ekteskapets varighet (ar) Divorces, by duration of marriage (years) Under 3-4 5-9 10-1415-19 20-24 251 3 og over Skilsmisser etter barnetall Divorces, by number of children 1 2 3 4 5 og 6' over 1962 2 439 3 238 204 353 725 441 330 222 164 682 826 580 237 59 39 16 2 436 1963 2 439 3 404 188 403 668 457 331 209 183 657 815 576 234 87 48 22 2 462 1964 2 556 3 590 205 389 725 451 350 209 227 641 898 610 251 104 29 23 2 672 1965 2 581 3 572 207 398 719 438 360 223 236 670 855 657 266 85 32 16 2 824 1966 2 672 3 711 224 420 774 433 369 205 247 695 896 660 273 92 36 20 3 283 Kilda : NOS Folkemengdens bevegelse. Source: NOS Vital Statistics and Migration Statistics. Notes: 1 25 and over. 2 6 and over. Mannens alder Age of husband Under 20 fir years.. . 20-24 25-29 * * » • • • • • • 30-34 » • • 35-39 40-44 * • • 45-49 5 5 • • • 50-54 * • • • 55-59 * 5 .. 60-64 • • • 65-69 5 * • • • 70 fir og over and over Uoppgito Unknown I alt Total Tabell 27. Skilsmisser etter ektefellenes alder. 1966. Divorces by age of wife and husband. I alt Total Under 20 ãr years 20- 24 it 25- 29 ar 30- 34 *r 35- 39 Hustruens alder Age of wife 40- 44 ;kr 49 45- ir 54 50- ar 59 55- ar 64 60- is 69 65- fa 70 is og over and over 4 3 1 224 20 180 23 1 513 4 228 238 35 6 2 418 1 48 184 147 24 9 3 1 1 374 13 82 114 107 39 7 7 3 1 1 349 5 13 41 121 123 37 7 2 281 2 6 15 33 91 100 24 7 2 1 226 1 8 19 33 72 68 21 3 1 153 1 3 12 28 52 46 10 1 77 3 4 10 14 23 19 3 1 31 1 3 5 4 8 10 22 2 2 3 2 8 5 2 672 28 478 547 364 313 314 262 179 110 44 23 7 3 Kilde: NOS Folkemengdens bevegelse. Source: NOS Vital Statistics and Migration Statistics.
- Page 2 and 3: PUBLIKASJONER FRA STATISTISK SENTRA
- Page 4 and 5: NORGES OFFISIELLE STATISTIKK XII 23
- Page 6 and 7: Forord Statistisk Arbok inneholder
- Page 8 and 9: Innhold Contents Kapitler: Chapters
- Page 10 and 11: *7 Tabell Side 50. Dodeligheten av
- Page 12 and 13: *9 Tabell Side 124. Skogkultur- og
- Page 14 and 15: *11 Tabell Side 187. Verdiindeks fo
- Page 16 and 17: *13 Tabell Side 261. Kommunenes kon
- Page 18 and 19: *15 Tabell XVI. Sosiale forhold. Si
- Page 20 and 21: *17 Tabell Side 404. BokmM og nynor
- Page 22 and 23: *1 0 Side Beer, avkasting 72 Beker
- Page 24 and 25: *21 Side skattytere, etterskottspli
- Page 26 and 27: *23 Side Passasjertransport, ferjer
- Page 28 and 29: * 25 Side hogstpriser 246 tommerpri
- Page 30 and 31: *27 Page Consiliation councils 281
- Page 32 and 33: *29 Page Nursing homes 30, 31 Nursi
- Page 34 and 35: Tabell 1. Geografiske forhold. 1 Ge
- Page 36 and 37: Stasjon Station Oslo Normal 5,9 - 4
- Page 38 and 39: 5 Tabell 4. Hjemmehorende folkemeng
- Page 40 and 41: 7 Tabell 8. Hiemmehorende folkemeng
- Page 42 and 43: 9 Tabell 8 (forts.). Hjemmehorende
- Page 44 and 45: Alder Age I alt Total 15-19 AI. yea
- Page 46 and 47: 13 Tabell 15. Personer 15 fir og me
- Page 48 and 49: 15 Tabell 17. Personer utenfor Stat
- Page 50 and 51: 17 Tabell 20. Folkemengdens Invegel
- Page 54 and 55: 21 Tabell 28. Fate og dodfate. Live
- Page 56 and 57: 23 Tabell 32. Dadeligheten i 1. lev
- Page 58 and 59: 25 Tabell 36. Dodeligheten etter fy
- Page 60 and 61: 27 Tabell 39. Dedelighetstabeller.
- Page 62 and 63: Kommunetype Category of municipalit
- Page 64 and 65: 2 990 2 978 4 006 6 294 6 531 6 913
- Page 66 and 67: 1rlig gjennomsnitt Annual average .
- Page 68 and 69: 35 Deaths by age and cause. Deaths
- Page 70 and 71: 37 Tabell 55. Dedsfall ved yrkesuly
- Page 72 and 73: 39 Tabell 58. Vernepliktige etter s
- Page 74 and 75: 41 Tabell 61. Sysselsatte selvstend
- Page 76 and 77: 43 Salaried employees and wage earn
- Page 78 and 79: 45 Tabell 66. Utlendinger i arbeid
- Page 80 and 81: 47 Tabell 69. Faktisk arbeidstid pr
- Page 82 and 83: 49 Tabell 74. Landsorganisasjonen i
- Page 84 and 85: 51 Tabell 75 (forts.). Arbeidstaker
- Page 86 and 87: 53 Tabell 77. Nasjonalprodukt etter
- Page 88 and 89: 55 Tabell 80. Faktorinntekt etter m
- Page 90 and 91: 57 Tabell 84. Private inntekter og
- Page 92 and 93: 59 Tabell 87 (forts.). Utenriksregn
- Page 94 and 95: 61 Fylke County Tabell 89. Landarea
- Page 96 and 97: 63 Tabell 92. Brukene etter jordbru
- Page 98 and 99: 65 Agricultural area by county. Dec
- Page 100 and 101: 67 Livestock by county. Finnmark Ve
- Page 102 and 103:
69 Ar Year 14/4__18/4 Menn Males Ta
- Page 104 and 105:
71 Tabell 105. Avling i jordbruket.
- Page 106 and 107:
73 Tabell 107. Produksjon av kumjol
- Page 108 and 109:
75 Tabell 110. Jordbrukets totalreg
- Page 110 and 111:
77 Tabell 112. Tin.glyste hjemmelso
- Page 112 and 113:
79 Tabell 116. Skogarealet etter ei
- Page 114 and 115:
81 Tabell 119. Skogtaksering. Produ
- Page 116 and 117:
Ar Year I alt' Total regenerated ar
- Page 118 and 119:
1960 1961 1962 1963 1964 1965 1966
- Page 120 and 121:
87 1962 1963 1964 1965 1966 Ar og f
- Page 122 and 123:
89 Landings and landed value of fis
- Page 124 and 125:
91 Tabell 136. Skreifisket og varto
- Page 126 and 127:
93 Tabell 141. Fangstmengde av vikt
- Page 128 and 129:
95 Tabell 145. Hvalfangsten. 1 Whal
- Page 130 and 131:
97 Mining and manufacturing. Princi
- Page 132 and 133:
99 Tabell 149. Bergverksdrift og in
- Page 134 and 135:
101 Mining and manufacturing by maj
- Page 136 and 137:
103 Tabell 152 (forts.). Bergverksd
- Page 138 and 139:
• 105 Tabell 152 (forts.). Bergve
- Page 140 and 141:
107 Tabell 153. Meieridrift. Dairyi
- Page 142 and 143:
109 Tabell 155. Indekser over produ
- Page 144 and 145:
111 Tabell 158. Bergverksdrift og i
- Page 146 and 147:
113 Ar Year Fylke County Tabell 162
- Page 148 and 149:
115 Tabell 165. Maskininstallasjon
- Page 150 and 151:
Bedrifter med sysselsetting Establi
- Page 152 and 153:
119 Year Tabell 173. Innforsel og u
- Page 154 and 155:
121 Tabell 174 (forts.). Innforsel
- Page 156 and 157:
123 Tabell 174 (forts.). Innforsel
- Page 158 and 159:
125 Praha 174 (forts.). Inaaforsel
- Page 160 and 161:
Utforsel (forts.). 127 Tabell 174 (
- Page 162 and 163:
129 Tabell 174 (forts). Innforsel o
- Page 164 and 165:
131 Tabell 175 (forts.). Indekser f
- Page 166 and 167:
133 1000 kr. Imports and exports by
- Page 168 and 169:
135 1000 kr. Imports and exports by
- Page 170 and 171:
137 1000 kr. Imports and exports by
- Page 172 and 173:
130 Tabell 177 (forts.). Innforsels
- Page 174 and 175:
141 Tabell 177 (forts.). Innforsels
- Page 176 and 177:
143 Tabell 179. Varehandel. Hovedta
- Page 178 and 179:
145 Tabell 182. Varehandel. Hovedta
- Page 180 and 181:
147 Tabell 185. Forretningsmessig t
- Page 182 and 183:
149 Tabell 188. Forbrukosamvirket.
- Page 184 and 185:
151 Tabell 190. Lager av viktigere
- Page 186 and 187:
153 Ved utgangen av aret At the end
- Page 188 and 189:
155 Tabell 198. Handelsflaten1 ette
- Page 190 and 191:
Ai Gj.sn. Year Aver. 1962.. 80 1963
- Page 192 and 193:
159 Tabell 207. Skipsfarten mellow
- Page 194 and 195:
161 Land og havn Country and port H
- Page 196 and 197:
Land og havn Country and port 163 T
- Page 198 and 199:
165 Tabell 211. Statsbanene : Banen
- Page 200 and 201:
167 Tabell 216. Statsbanenes bildri
- Page 202 and 203:
169 Tabell 220. Motorkjoretoyer og
- Page 204 and 205:
171 Tabell 224. Nye forerkort og fo
- Page 206 and 207:
173 Tabell 228. Veitrafikkulykker m
- Page 208 and 209:
175 Tabell 231. Veitrafikkulykker h
- Page 210 and 211:
177 Tabell 235. Land- og lufttransp
- Page 212 and 213:
179 Tabell 238. Ungdomsherberger, t
- Page 214 and 215:
is' Tabell 243. Brevpostl. til og f
- Page 216 and 217:
183 Tabell 247. Telefon-, telegram-
- Page 218 and 219:
185 Tabell 251. Norsk Rikskringkast
- Page 220 and 221:
187 Tabell 255. Den ordimere kommun
- Page 222 and 223:
189 Tabell 257. Personlige skattyte
- Page 224 and 225:
Nearing Industry Stataskattellkning
- Page 226 and 227:
193 Tabell 261. Kommunenes kontantb
- Page 228 and 229:
195 Tabell 262 (forts.). Kommunenes
- Page 230 and 231:
197 Net expenditure and tax revenue
- Page 232 and 233:
199 Central government balance shee
- Page 234 and 235:
201 Tabell 265 (forts.). Statsgjeld
- Page 236 and 237:
203 Tabell 266 (forts.). Statskasse
- Page 238 and 239:
205 Tabell 266 (forts.). Statskasse
- Page 240 and 241:
207 Tstbell 266 (forts.). Statskass
- Page 242 and 243:
209 Tabell 266 (forts.). Statskasse
- Page 244 and 245:
211 Tabell 268. Norges Bank. Balans
- Page 246 and 247:
213 Bank Bank UtlAn Loans Ihendehav
- Page 248 and 249:
215 Tabell 274. Forretningsbanker.
- Page 250 and 251:
217 Tabell 277. Sparebanker. Balans
- Page 252 and 253:
219 MINN= Tabell 280. Forretnings-
- Page 254 and 255:
221 Tabell 282. Kredittforeninger o
- Page 256 and 257:
223 Tabell 285. Livsforsikringssels
- Page 258 and 259:
• t25 Tabell 289. Branner og bran
- Page 260 and 261:
227 Tabell 293. Ihendehaverobligasj
- Page 262 and 263:
229 Tobeil 295. (King i kjeut kapit
- Page 264 and 265:
231 Loan-capital by industry. Mill.
- Page 266 and 267:
. 233 Foreign assets and liabilitie
- Page 268 and 269:
235 Credit market. Financial balanc
- Page 270 and 271:
287 Credit market. Financial balanc
- Page 272 and 273:
239 Tabell 303. Aksjekursindeks. 1
- Page 274 and 275:
.41 Driftatr Operating weir 'Italia
- Page 276 and 277:
243 4 •a'' +4 5 Z ,I,;,i:i ....c
- Page 278 and 279:
g45 Tabe.. 11 a _1., 7 Doe ipteser
- Page 280 and 281:
247 Tabell 319. Timefortjeneste I b
- Page 282 and 283:
240 Tabeti 319 (torts.). nitiadttle
- Page 284 and 285:
251 Tabell 322. Timefortjeneste for
- Page 286 and 287:
( iie lei t" I* fortjeneste i novem
- Page 288 and 289:
255 Tabell 327. Mfinedsfortjenestel
- Page 290 and 291:
257 Tabell 330. Mainedsfortjenestel
- Page 292 and 293:
259 Tabell 332. Leiligheter og hush
- Page 294 and 295:
261 Tabell 334. Syketrygden. Utgift
- Page 296 and 297:
263 Tabell 336. Syketrygden. Sykeda
- Page 298 and 299:
265 Tabell 339. Folketrygden. Alder
- Page 300 and 301:
267 Tabell 343. Folketrygden. Pensj
- Page 302 and 303:
269 Tabell 347. Yrkesskadetrygden.
- Page 304 and 305:
271 Tabell 349. Barnevern. Barn sat
- Page 306 and 307:
273 1964 1965 1966 1967 Ar Year Tab
- Page 308 and 309:
275 A.r Year Tabell 360. Forbruk 1
- Page 310 and 311:
277 Tabell 364. Siktede for forbryt
- Page 312 and 313:
279 Tabell 370. Dontfelte og botiag
- Page 314 and 315:
281 Tabell 375. Tvistemal avgjort v
- Page 316 and 317:
283 Ix Year I alt Total 1961 123 46
- Page 318 and 319:
235 Tabell 382. Elever i barneskole
- Page 320 and 321:
287 Tabell 388. Fag- og yrkesskoler
- Page 322 and 323:
289 Tabell 390. Universiteter og ho
- Page 324 and 325:
291 Tabell 393. Personer 15 fir og
- Page 326 and 327:
Persons 15 years and over by educat
- Page 328 and 329:
295 Tabell 395 (forts.). Spesialbib
- Page 330 and 331:
297 Tabell 396. Universitetsbibliot
- Page 332 and 333:
299 Tabell 402. Kommunale kinematog
- Page 334 and 335:
301 Tabell 405. Norges Idrettsforbu
- Page 336 and 337:
303 Tabell 408. Stortingsvalg. Stem
- Page 338 and 339:
305 Municipal elections. Persons en
- Page 340 and 341:
307 Municipal elections. Votes and
- Page 342 and 343:
300 INTERNASJONALE OVERSIKTER Tabel
- Page 344 and 345:
311 Tabell 414 (forts.). Areal, fol
- Page 346 and 347:
313 Tabell 414 (forts.). Areal, fol
- Page 348 and 349:
315 Land og byer Europa. NORGE Oslo
- Page 350 and 351:
Land og byer Sor-Amerika. ARGENTINA
- Page 352 and 353:
319 Tabell 416 (forts.). Folkemengd
- Page 354 and 355:
321 Tabell 417. Yrkesbefollcningen
- Page 356 and 357:
323 Tabell 418 (forts.). Galena!, f
- Page 358 and 359:
325 Tabell 420. Middellevetiden. 1
- Page 360 and 361:
327 etter kjonn og alder. 35-39 I 4
- Page 362 and 363:
329 etter kjonn og alder. 5-39 I 40
- Page 364 and 365:
331 innbyggere etter dodstirsak. It
- Page 366 and 367:
333 Tabell 424. Netto og brutto nas
- Page 368 and 369:
335 Tabell 426. Husdyrholdet. 1 100
- Page 370 and 371:
337 bruksareal og avling. 1966. 1.
- Page 372 and 373:
Land Ar I sut alt Peru . . . . 1965
- Page 374 and 375:
341 New 3 Tabell 431. Produksjon av
- Page 376 and 377:
Varesort og land Polen' Sovjetunion
- Page 378 and 379:
Varesort og land Zambia Canada] Sam
- Page 380 and 381:
347 Tabell 431 (forts.). Prodnksjon
- Page 382 and 383:
349 Tabell 431 (forte.). Produksjon
- Page 384 and 385:
351 Tabell 434. Verdien av utenriks
- Page 386 and 387:
353 lands innforsel, etter land. 1M
- Page 388 and 389:
355 Tabell 439. Innfersel og utfors
- Page 390 and 391:
357 Tabell 439 (forts.). Innforsel
- Page 392 and 393:
359 Tabell 439 (forts.). Innforsel
- Page 394 and 395:
361 Tabell 439 (forts.). Innforsei
- Page 396 and 397:
363 Tabell 441. Registrerte skip pa
- Page 398 and 399:
Land Tonnasje kommet og Witt Kommet
- Page 400 and 401:
367 Tabell 446. Automobiler. 1 1964
- Page 402 and 403:
369 Tabell 448. Personer innreist t
- Page 404 and 405:
371 Tabell 451. Postvesenet. 1 1964
- Page 406 and 407:
Land 1963 I 1964 1965 Land 1963 196
- Page 408 and 409:
375 Land Myntenhet Norge Krone Danm
- Page 410 and 411:
377 Tabell 459. Konsumprisindeks. 1
- Page 412 and 413:
379 Tabell 461. Forbruket av avispa
- Page 414 and 415:
381 Tabell 463. Offentlige utgifter
- Page 416 and 417:
383 Land Tabell 465. Kringkasting :
- Page 418 and 419:
385 Publikasjoner sendt ut fra Stat
- Page 420 and 421:
387 I serien Samfunnsokonomiske stu
- Page 422:
Pris kr. 15,00 Publikasjonen utgis