CARTA EDUCATIVA do CONCELHO DE OEIRAS - Câmara ...
CARTA EDUCATIVA do CONCELHO DE OEIRAS - Câmara ...
CARTA EDUCATIVA do CONCELHO DE OEIRAS - Câmara ...

Create successful ePaper yourself
Turn your PDF publications into a flip-book with our unique Google optimized e-Paper software.
______________________________________________<strong>CARTA</strong> <strong>EDUCATIVA</strong> DO <strong>CONCELHO</strong> <strong>DE</strong> <strong>OEIRAS</strong><br />
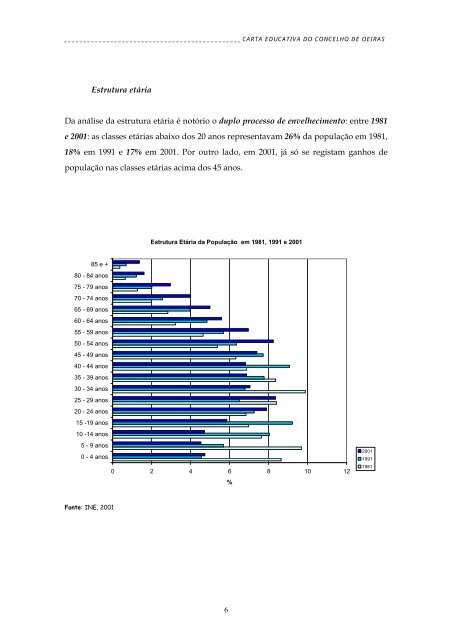
Estrutura etária<br />
Da análise da estrutura etária é notório o duplo processo de envelhecimento: entre 1981<br />
e 2001: as classes etárias abaixo <strong>do</strong>s 20 anos representavam 26% da população em 1981,<br />
18% em 1991 e 17% em 2001. Por outro la<strong>do</strong>, em 2001, já só se registam ganhos de<br />
população nas classes etárias acima <strong>do</strong>s 45 anos.<br />
85 e +<br />
80 - 84 anos<br />
75 - 79 anos<br />
70 - 74 anos<br />
65 - 69 anos<br />
60 - 64 anos<br />
55 - 59 anos<br />
50 - 54 anos<br />
45 - 49 anos<br />
40 - 44 anos<br />
35 - 39 anos<br />
30 - 34 anos<br />
25 - 29 anos<br />
20 - 24 anos<br />
15 -19 anos<br />
10 -14 anos<br />
5 - 9 anos<br />
0 - 4 anos<br />
Fonte: INE, 2001<br />
Estrutura Etária da População em 1981, 1991 e 2001<br />
0 2 4 6 8 10 12<br />
6<br />
%<br />
2001<br />
1991<br />
1981