

projeto beija-flor - Cepa - Governo do Estado de Santa Catarina
projeto beija-flor - Cepa - Governo do Estado de Santa Catarina
projeto beija-flor - Cepa - Governo do Estado de Santa Catarina

Create successful ePaper yourself
Turn your PDF publications into a flip-book with our unique Google optimized e-Paper software.
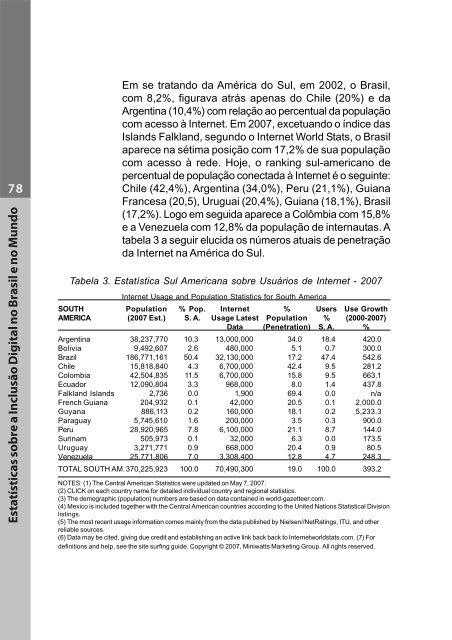
78Estatísticas sobre a Inclusão Digital no Brasil e no Mun<strong>do</strong>Em se tratan<strong>do</strong> da América <strong>do</strong> Sul, em 2002, o Brasil,com 8,2%, figurava atrás apenas <strong>do</strong> Chile (20%) e daArgentina (10,4%) com relação ao percentual da populaçãocom acesso à Internet. Em 2007, excetuan<strong>do</strong> o índice dasIslands Falkland, segun<strong>do</strong> o Internet World Stats, o Brasilaparece na sétima posição com 17,2% <strong>de</strong> sua populaçãocom acesso à re<strong>de</strong>. Hoje, o ranking sul-americano <strong>de</strong>percentual <strong>de</strong> população conectada à Internet é o seguinte:Chile (42,4%), Argentina (34,0%), Peru (21,1%), GuianaFrancesa (20,5), Uruguai (20,4%), Guiana (18,1%), Brasil(17,2%). Logo em seguida aparece a Colômbia com 15,8%e a Venezuela com 12,8% da população <strong>de</strong> internautas. Atabela 3 a seguir elucida os números atuais <strong>de</strong> penetraçãoda Internet na América <strong>do</strong> Sul.Tabela 3. Estatística Sul Americana sobre Usuários <strong>de</strong> Internet - 2007Internet Usage and Population Statistics for South AmericaSOUTH Population % Pop. Internet % Users Use GrowthAMERICA (2007 Est.) S. A. Usage Latest Population % (2000-2007)Data (Penetration) S. A. %Argentina 38,237,770 10.3 13,000,000 34.0 18.4 420.0Bolivia 9,492,607 2.6 480,000 5.1 0.7 300.0Brazil 186,771,161 50.4 32,130,000 17.2 47.4 542.6Chile 15,818,840 4.3 6,700,000 42.4 9.5 281.2Colombia 42,504,835 11.5 6,700,000 15.8 9.5 663.1Ecua<strong>do</strong>r 12,090,804 3.3 968,000 8.0 1.4 437.8Falkland Islands 2,736 0.0 1,900 69.4 0.0 n/aFrench Guiana 204,932 0.1 42,000 20.5 0.1 2,000.0Guyana 886,113 0.2 160,000 18.1 0.2 5,233.3Paraguay 5,745,610 1.6 200,000 3.5 0.3 900.0Peru 28,920,965 7.8 6,100,000 21.1 8.7 144.0Surinam 505,973 0.1 32,000 6.3 0.0 173.5Uruguay 3,271,771 0.9 668,000 20.4 0.9 80.5Venezuela 25,771,806 7.0 3,308,400 12.8 4.7 248.3TOTAL SOUTH AM.370,225,923 100.0 70,490,300 19.0 100.0 393.2NOTES: (1) The Central American Statistics were updated on May 7, 2007.(2) CLICK on each country name for <strong>de</strong>tailed individual country and regional statistics.(3) The <strong>de</strong>mographic (population) numbers are based on data contained in world-gazetteer.com.(4) Mexico is inclu<strong>de</strong>d together with the Central American countries according to the United Nations Statistical Divisionlistings.(5) The most recent usage information comes mainly from the data published by Nielsen//NetRatings, ITU, and otherreliable sources.(6) Data may be cited, giving due credit and establishing an active link back back to Internetworldstats.com. (7) For<strong>de</strong>finitions and help, see the site surfing gui<strong>de</strong>. Copyright © 2007, Miniwatts Marketing Group. All rights reserved.


