Gastroenterology Today Winter 2023
Gastroenterology Today Winter 2023
Gastroenterology Today Winter 2023

Create successful ePaper yourself
Turn your PDF publications into a flip-book with our unique Google optimized e-Paper software.
Peng et al. BMC <strong>Gastroenterology</strong> (<strong>2023</strong>) 23:219<br />
FEATURE<br />
Page 5 of 9<br />
Peng et al. BMC <strong>Gastroenterology</strong> (<strong>2023</strong>) 23:219<br />
Page 6 of 9<br />
FEATURE<br />
GASTROENTEROLOGY TODAY – WINTER <strong>2023</strong><br />
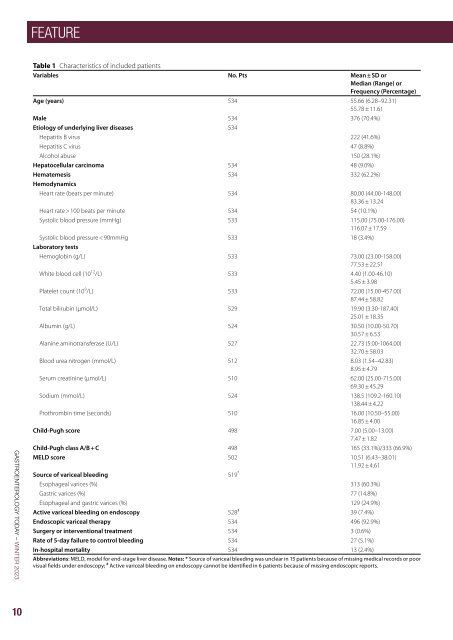
Table 1 Characteristics of included patients<br />
Variables No. Pts Mean ± SD or<br />
Median (Range) or<br />
Frequency (Percentage)<br />
Age (years) 534 55.66 (6.28–92.31)<br />
55.78 ± 11.61<br />
Male 534 376 (70.4%)<br />
Etiology of underlying liver diseases 534<br />
Hepatitis B virus 222 (41.6%)<br />
Hepatitis C virus 47 (8.8%)<br />
Alcohol abuse 150 (28.1%)<br />
Hepatocellular carcinoma 534 48 (9.0%)<br />
Hematemesis 534 332 (62.2%)<br />
Hemodynamics<br />
Heart rate (beats per minute) 534 80.00 (44.00-148.00)<br />
83.36 ± 13.24<br />
Heart rate > 100 beats per minute 534 54 (10.1%)<br />
Systolic blood pressure (mmHg) 533 115.00 (75.00-176.00)<br />
116.07 ± 17.59<br />
Systolic blood pressure < 90mmHg 533 18 (3.4%)<br />
Laboratory tests<br />
Hemoglobin (g/L) 533 73.00 (23.00-158.00)<br />
77.53 ± 22.51<br />
White blood cell (10 12 /L) 533 4.40 (1.00-46.10)<br />
5.45 ± 3.98<br />
Platelet count (10 9 /L) 533 72.00 (15.00-457.00)<br />
87.44 ± 58.82<br />
Total bilirubin (µmol/L) 529 19.90 (3.30-187.40)<br />
25.01 ± 18.35<br />
Albumin (g/L) 524 30.50 (10.00-50.70)<br />
30.57 ± 6.53<br />
Alanine aminotransferase (U/L) 527 22.73 (5.00-1064.00)<br />
32.70 ± 58.03<br />
Blood urea nitrogen (mmol/L) 512 8.03 (1.54–42.83)<br />
8.95 ± 4.79<br />
Serum creatinine (µmol/L) 510 62.00 (25.00-715.00)<br />
69.30 ± 45.29<br />
Sodium (mmol/L) 524 138.5 (109.2-160.10)<br />
138.44 ± 4.22<br />
Prothrombin time (seconds) 510 16.00 (10.50–55.00)<br />
16.85 ± 4.00<br />
Child-Pugh score 498 7.00 (5.00–13.00)<br />
7.47 ± 1.82<br />
Child-Pugh class A/B + C 498 165 (33.1%)/333 (66.9%)<br />
MELD score 502 10.51 (6.43–38.01)<br />
11.92 ± 4.61<br />
Source of variceal bleeding 519 *<br />
Esophageal varices (%) 313 (60.3%)<br />
Gastric varices (%) 77 (14.8%)<br />
Esophageal and gastric varices (%) 129 (24.9%)<br />
Active variceal bleeding on endoscopy 528 # 39 (7.4%)<br />
Endoscopic variceal therapy 534 496 (92.9%)<br />
Surgery or interventional treatment 534 3 (0.6%)<br />
Rate of 5-day failure to control bleeding 534 27 (5.1%)<br />
In-hospital mortality 534 13 (2.4%)<br />
Abbreviations: MELD, model for end-stage liver disease. Notes: * Source of variceal bleeding was unclear in 15 patients because of missing medical records or poor<br />
visual fields under endoscopy; # Active variceal bleeding on endoscopy cannot be identified in 6 patients because of missing endoscopic reports.<br />
Table 2 Outcomes according to the timing of endoscopy defined as the interval from the last presentation of AVB to endoscopy<br />
Overall analysis<br />
< 12h ≥ 12h P value < 24h ≥ 24h P value < 48h ≥ 48h P value<br />
(N = 55) (N = 434)<br />
(N = 114) (N = 357)<br />
(N = 226) (N = 242)<br />
Rate of 5-day failure to control bleeding 6 (10.9%) 14 (3.2%) 0.007 15 (13.2%) 8 (2.2%) < 0.001 20 (8.8%) 5 (2.1%) 0.001<br />
In-hospital mortality 5 (9.1%) 6 (1.4%) < 0.001 6 (5.3%) 6 (1.7%) 0.035 8 (3.5%) 5 (2.1%) 0.332<br />
PSM analysis<br />
hematemesis, systolic blood pressure < 90 mmHg, Child-<br />
Multivariate logistic regression analysis demonstrated that the interval<br />
Pugh class B/C, and active variceal bleeding on endoscopy,<br />
white blood cell, and blood urea nitrogen than<br />
from last presentation of AVB to endoscopy < 12 h was not significantly<br />
associated with 5-day failure to control bleeding (OR = 2.889, 95% CI:<br />
delayed endoscopy group (Supplementary Table 5). Early<br />
0.912–9.151; P = 0.071). Multivariate Cox regression analysis showed<br />
endoscopy group had a significantly higher rate of 5-day<br />
that the interval from last presentation of AVB to endoscopy < 12 h was<br />
failure to control bleeding than delayed endoscopy group,<br />
not significantly associated with in-hospital death (HR = 2.828, 95% CI:<br />
but a statistically similar in-hospital mortality (Table 2).<br />
0.706–11.320, P = 0.142).<br />
Multivariate logistic regression analysis demonstrated<br />
that the interval from last presentation of AVB to endoscopy<br />
< 48 h was significantly associated with a higher rate<br />
In the PSM analysis, 46 patients were matched to each group<br />
(Supplementary Table 2). There was no significant difference in rate of<br />
of 5-day failure to control bleeding (OR = 4.171, 95% CI:<br />
5-day failure to control bleeding or in-hospital mortality between the<br />
1.486–11.708; P = 0.007). Cox regression analysis showed<br />
two groups (Table 2).<br />
that the interval from last presentation of AVB to endoscopy<br />
< 48 h was not significantly associated with in-hospital<br />
death (HR = 0.808, 95% CI: 0.237–2.750, P = 0.733).<br />
< 24 h versus ≥ 24 h. In the overall-analysis, early endoscopy group<br />
was significantly older and had higher proportions of HCV infection,<br />
In the PSM analysis, 165 patients were matched to each<br />
hematemesis, systolic blood pressure < 90 mmHg, Child-Pugh class<br />
group (Supplementary Table 6). Early endoscopy group<br />
B/C, and active variceal bleeding on endoscopy and white blood<br />
had a significantly higher rate of 5-day failure to control<br />
cell than delayed endoscopy group (Supplementary Table 3). Early<br />
bleeding than delayed endoscopy group, but a statistically<br />
endoscopy group had significantly higher rate of 5-day failure to control<br />
similar in-hospital mortality (Table 2).<br />
bleeding and in-hospital mortality than delayed endoscopy group<br />
(Table 2).<br />
Time to endoscopy according to the interval from the<br />
admission to endoscopy<br />
Multivariate logistic regression analysis demonstrated that the interval<br />
< 12 h versus ≥ 12 h. In the overall-analysis, early endoscopy<br />
group was significantly older and had significantly<br />
from last presentation of AVB to endoscopy < 24 h was associated with a higher rate of 5-day failure to control bleeding (OR =<br />
higher proportions of HCV infection, Child-Pugh class<br />
6.065, 95% CI: 2.336–15.749; P < 0.001). Multivariate Cox regression<br />
B/C, and active variceal bleeding on endoscopy, white<br />
analysis showed that the interval from last presentation of AVB to<br />
blood cell, total bilirubin, blood urea nitrogen, Childendoscopy<br />
< 24 h was not significantly associated with in-hospital<br />
Pugh score, and MELD score than delayed endoscopy<br />
death (HR = 1.400, 95% CI: 0.403–4.860, P = 0.597).<br />
group (Supplementary Table 7). There was no significant<br />
difference in rate of 5-day failure to control bleeding or<br />
In the PSM analysis, 97 patients were matched to each group<br />
in-hospital mortality between the two groups (Table 3).<br />
(Supplementary Table 4). There was no significant difference in rate of<br />
5-day failure to control bleeding or in-hospital mortality between the<br />
two groups (Table 2).<br />
< 12h<br />
(N = 46)<br />
≥ 12h<br />
(N = 46)<br />
P value<br />
< 24h<br />
(N = 97)<br />
≥ 24h<br />
(N = 97)<br />
P value<br />
< 48h<br />
(N = 165)<br />
≥ 48h<br />
(N = 165)<br />
Rate of 5-day failure to control bleeding 4 (8.7%) 3 (6.5%) 1.000 13 (13.4%) 6 (6.2%) 0.091 16 (9.7%) 4 (2.4%) 0.009<br />
In-hospital mortality 3 (6.5%) 2 (4.3%) 1.000 4 (4.1%) 3 (3.1%) 1.000 5 (3.0%) 4 (2.4%) 1.000<br />
Abbreviations: AVB, acute variceal bleeding; PSM, propensity score matching<br />
P value<br />
Table 3 Outcomes according to the timing of endoscopy defined as the interval from the admission to endoscopy<br />
Overall analysis<br />
< 12h ≥ 12h P value < 24h ≥ 24h P value < 48h ≥ 48h P value<br />
(N = 75) (N = 453)<br />
(N = 175) (N = 349)<br />
(N = 289) (N = 236)<br />
Rate of 5-day failure to control bleeding 5 (6.7%) 21 (4.6%) 0.451 10 (5.7%) 17 (4.9%) 0.680 13 (4.5%) 13 (5.5%) 0.596<br />
In-hospital mortality 4 (5.3%) 8 (1.8%) 0.055 7 (4.0%) 6 (1.7%) 0.113 8 (2.8%) 5 (2.1%) 0.634<br />
PSM analysis<br />
< 12h<br />
(N = 63)<br />
≥ 12h<br />
(N = 63)<br />
P value<br />
< 24h<br />
(N = 155)<br />
≥ 24h<br />
(N = 155)<br />
P value<br />
< 48h<br />
(N = 199)<br />
≥ 48h<br />
(N = 199)<br />
Rate of 5-day failure to control bleeding 3 (4.8%) 8 (12.7%) 0.205 8 (5.2%) 12 (7.7%) 0.355 9 (4.5%) 12 (6.0%) 0.501<br />
In-hospital mortality 3 (4.8%) 3 (4.8%) 1.000 6 (3.9%) 4 (2.6%) 0.750 4 (2.0%) 5 (2.5%) 1.000<br />
Abbreviations: PSM, propensity score matching<br />
P value<br />
Multivariate logistic regression analysis demonstrated<br />
< 48 h versus ≥ 48 h. In the overall-analysis, early endoscopy group<br />
that the interval from admission to endoscopy < 12 h was<br />
was significantly older and had significantly higher proportions of HCV<br />
not significantly associated with 5-day failure to control<br />
infection, hematemesis, systolic blood pressure < 90 mmHg, Childbleeding<br />
(OR = 0.873, 95% CI: 0.243–3.144; P = 0.836).<br />
Pugh class B/C, and active variceal bleeding on endoscopy, white<br />
blood<br />
Multivariate<br />
cell, and blood<br />
Cox<br />
urea<br />
regression<br />
nitrogen than<br />
analysis<br />
delayed endoscopy<br />
showed that<br />
group<br />
the<br />
(Supplementary<br />
interval from<br />
Table<br />
admission<br />
5). Early<br />
to<br />
endoscopy<br />
endoscopy<br />
group<br />
<<br />
had<br />
12 h<br />
a significantly<br />
was not significantly<br />
higher rate of<br />
associated<br />
5-day failure to<br />
with<br />
control<br />
in-hospital<br />
bleeding than<br />
death<br />
delayed<br />
(HR<br />
endoscopy<br />
= 1.981,<br />
group, 95% CI: but 0.467–8.406, a statistically similar P = 0.354). in-hospital mortality (Table 2).<br />
In the PSM analysis, 63 patients were matched to each<br />
Multivariate group (Supplementary logistic regression Table analysis 8). demonstrated There was that no significant<br />
the interval<br />
from difference last presentation in rate of of AVB 5-day to endoscopy failure to < 48 control h was significantly bleeding or<br />
associated in-hospital with mortality a higher rate between of 5-day the failure two to control groups bleeding (Table(OR<br />
3).<br />
= 4.171, < 2495% h versus CI: 1.486–11.708; ≥ 24 h. P = In 0.007). the Cox overall-analysis, regression analysis early<br />
showed endoscopy that the group interval was from significantly last presentation older of AVB and to endoscopy had significantly<br />
48 h was higher not significantly proportion associated of Child-Pugh with in-hospital class death B/C (HR = and<br />
<<br />
0.808, Child-Pugh 95% CI: 0.237–2.750, score than P delayed = 0.733). endoscopy group (Supplementary<br />
Table 9). There was no significant difference<br />
In in the rate PSM of analysis, 5-day failure 165 patients to control were matched bleeding to each or group in-hospital<br />
(Supplementary mortality between Table 6). the Early two endoscopy groups group (Table had 3). a significantly<br />
higher Multivariate rate of 5-day logistic failure to regression control bleeding analysis than delayed demonstrated<br />
endoscopy<br />
group, that the but interval a statistically from similar admission in-hospital to mortality endoscopy (Table < 2). 24 h was<br />
not significantly associated with 5-day failure to control<br />
Time bleeding to endoscopy (OR = 0.867, according 95% to the CI: interval 0.353–2.132; from the admission P = 0.756).<br />
to Multivariate endoscopy Cox regression analysis showed that the<br />
< interval 12 h versus from ≥ 12 admission h. In the overall-analysis, to endoscopy early < 24 endoscopy h was not group sig-<br />
was significantly associated older and with had significantly in-hospital higher death proportions (HR = of 2.554,<br />
HCV 95% infection, CI: 0.747–8.732, Child-Pugh class P = 0.135). B/C, and active variceal bleeding<br />
on In endoscopy, the PSM white analysis, blood cell, 155 total patients bilirubin, were blood matched urea nitrogen, to each<br />
Child-Pugh group (Supplementary score, and MELD Table score than 10). delayed There was endoscopy no significant group<br />
(Supplementary difference in Table rate 7). of There 5-day was failure no significant to control difference bleeding rate of or<br />
5-day in-hospital failure to mortality control bleeding between or in-hospital the two mortality groups between (Table the 3).<br />
two<br />
<<br />
groups<br />
48 h<br />
(Table<br />
versus<br />
3).<br />
≥ 48 h. In the overall-analysis, early<br />
endoscopy group was significantly older than delayed<br />
Multivariate logistic regression analysis demonstrated that the interval<br />
from admission to endoscopy < 12 h was not significantly associated<br />
GASTROENTEROLOGY TODAY – WINTER <strong>2023</strong><br />
10 11