Tabela 21 – Da<strong>do</strong>s de Cota e Vazão Observa<strong>da</strong> nos trechos <strong>do</strong> <strong>córrego</strong> Barba<strong>do</strong> no perío<strong>do</strong> de Dezembro de 2010 a abril 2011 Chuva Chuva Chuva Chuva 11-12-2010 06-02-2011 27-03-2011 16-04-2011 Cota Vazão Cota Vazão Cota Vazão Cota Vazão (cm) (m³/s) (cm) (m³/s) (cm) (m³/s) (cm) (m³/s) 8 1,522221 8 1,239071 32 7,619972 80 28,48709 8 1,9332 8 1,274626 32 10,72715 80 27,37502 8 1,620163 10 1,537514 30 9,503119 70 23,65819 10 2,026314 12 2,230227 28 8,263111 70 22,51057 12 2,8998 14 2,556723 26 6,552759 60 19,4268 12 3,066031 16 3,330448 24 6,524976 60 19,95389 14 3,743964 18 3,825719 22 4,631805 60 18,97249 37 11,35834 22 5,433759 20 3,712688 50 14,89569 37 10,9502 24 5,966517 18 4,744305 40 11,82299 40 12,55569 26 6,735603 18 4,376789 35 9,667955 40 13,35159 30 8,345434 16 3,634526 30 8,227687 47 15,22263 30 8,09378 14 2,504622 30 8,124911 47 14,75567 30 8,789273 14 3,040201 30 8,18017 46 14,48043 30 9,066323 12 1,963678 28 7,239333 40 14,07505 28 7,947828 10 1,591152 25 6,454278 40 13,71415 26 6,876586 10 1,621033 25 6,303762 38 11,99352 22 5,789127 8 1,737258 20 5,046839 36 11,04794 20 5,415109 6 1,31119 18 4,257189 35 10,43556 18 4,655637 4 0,742538 18 4,227317 38 11,08414 18 4,498028 4 0,670447 14 3,140327 35 10,01346 14 3,274966 2 0,34528 12 2,620381 30 8,845644 12 2,817399 10 2,087772 10 2,313443 10 2,037023 10 2,101727 10 1,970002 10 2,154735 10 1,966372 12 2,620009 10 2,150331 10 2,125239 10 1,960799 8 1,560642 6 1,218851 6 1,249251 4 0,717443 2 0,351081 0,1 0,017969 0,1 0,01909 85
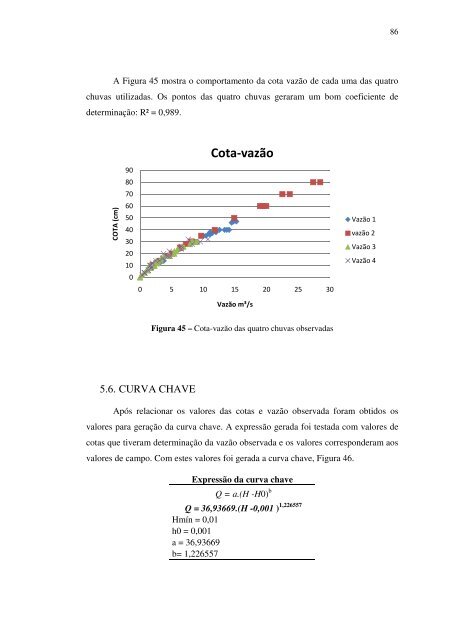
A Figura 45 mostra o comportamento <strong>da</strong> cota vazão de ca<strong>da</strong> uma <strong>da</strong>s quatro chuvas utiliza<strong>da</strong>s. Os pontos <strong>da</strong>s quatro chuvas geraram um bom coeficiente de determinação: R² = 0,989. COTA (cm) 90 80 70 60 50 40 30 20 10 0 5.6. CURVA CHAVE Cota-vazão 0 5 10 15 20 25 30 Vazão m³/s Figura 45 – Cota-vazão <strong>da</strong>s quatro chuvas observa<strong>da</strong>s Após relacionar os valores <strong>da</strong>s cotas e vazão observa<strong>da</strong> foram obti<strong>do</strong>s os valores para geração <strong>da</strong> curva chave. A expressão gera<strong>da</strong> foi testa<strong>da</strong> com valores de cotas que tiveram determinação <strong>da</strong> vazão observa<strong>da</strong> e os valores corresponderam aos valores de campo. Com estes valores foi gera<strong>da</strong> a curva chave, Figura 46. Expressão <strong>da</strong> curva chave Q = a.(H -H0) b Q = 36,93669.(H -0,001 ) 1,226557 Hmín = 0,01 h0 = 0,001 a = 36,93669 b= 1,226557 Vazão 1 vazão 2 Vazão 3 Vazão 4 86
- Page 1 and 2:
UNIVERSIDADE FEDERAL DE MATO GROSSO
- Page 3:
C331c Ventura, Rosângela Maria Gua
- Page 6 and 7:
AGRADECIMENTOS Aprendi com a Ciênc
- Page 8 and 9:
SUMÁRIO 1. INTRODUÇÃO ..........
- Page 10 and 11:
LISTA DE FIGURAS Figura 1 - Popula
- Page 12 and 13:
LISTA DE TABELAS Tabela 1 - Causas
- Page 14 and 15:
RESUMO VENTURA, R. M. G. Caracteriz
- Page 16 and 17:
1. INTRODUÇÃO Com a crescente ocu
- Page 18 and 19:
para o cenário futuro intervençõ
- Page 20 and 21:
2. REVISÃO BIBLIOGRÁFICA A urbani
- Page 22 and 23:
airros planejados e com infraestrut
- Page 24 and 25:
2.1.1. Medidas de Controle Existem
- Page 26 and 27:
sugeridos e aplicados na cidade de
- Page 28 and 29:
O Conselho Nacional de Meio Ambient
- Page 30 and 31:
6.766/79. Em seu artigo 30 é relat
- Page 32 and 33:
efêmeros. Lança & Costa (2001) cl
- Page 34 and 35:
t c = Sendo: L n i ∑ i= 1 Vi tc:
- Page 36 and 37:
e evitando o carreamento e erosão
- Page 38 and 39:
Tucci, (2003) fala sobre as limita
- Page 40 and 41:
anual, mensal, semanal, diário, et
- Page 42 and 43:
Figura 6 - Layout de uma seção de
- Page 44 and 45:
3. ÁREA DE ESTUDO 3.1. CÓRREGO BA
- Page 46 and 47:
subordinadas a metarenitos do Grupo
- Page 48 and 49:
Os impactos na bacia estão interli
- Page 50 and 51: surgiram a partir da invasão de va
- Page 52 and 53: este trecho é caracterizado por ap
- Page 54 and 55: mudança na cor da água e ainda é
- Page 56 and 57: infiltrada, dentre outros papéis.
- Page 58 and 59: Figura 20 - Margem degradada (2009)
- Page 60 and 61: Figura 23 - Resíduos carreados em
- Page 62 and 63: LIMA (2001) alertou que o rio Cuiab
- Page 64 and 65: ponto para outro dentro da bacia hi
- Page 66 and 67: A questão de saúde pública deve
- Page 68 and 69: 4. MATERIAIS E MÉTODOS O estudo do
- Page 70 and 71: contribuíram com seus estudos. As
- Page 72 and 73: Como o estudo objetiva quantificar
- Page 74 and 75: E Sin = L E, por fim, a densidade d
- Page 76 and 77: dados poderiam ser comprometidos de
- Page 78 and 79: na área são de 2,60 m de altura n
- Page 80 and 81: Com geoprocessamento, envolvendo di
- Page 82 and 83: Tabela 10 - Coeficientes de escoame
- Page 84 and 85: A série mensal de chuvas foi descr
- Page 86 and 87: 5.2. DADOS FISIOGRAFICOS Os dados f
- Page 88 and 89: Figura 38 - Figura (a) Foto aérea
- Page 90 and 91: pavimento, 0,27 km² de solo expost
- Page 92 and 93: Tabela 16 - Formas de habitação p
- Page 94 and 95: Tabela 18. Figura 40 - Tempo de est
- Page 96 and 97: Tabela 19 - Saneamento, esgotamento
- Page 98 and 99: 5.4.5. Saneamento - Resíduos Sóli
- Page 102 and 103: Cota (m) 90 80 70 60 50 40 30 20 10
- Page 104 and 105: A Figura 48 representa graficamente
- Page 106 and 107: Figura 50 - Hidrograma de chuva 16-
- Page 108 and 109: A Figura 53 representa graficamente
- Page 110 and 111: Figura 55 - Hidrograma de chuva 18-
- Page 112 and 113: Figura 57 - Hidrograma da chuva de
- Page 114 and 115: Os hidrogramas demonstraram a grand
- Page 116 and 117: Dentre as sugestões há medidas n
- Page 118 and 119: É preciso ainda haver uma responsa
- Page 120 and 121: COSTA, T.; LANÇA, R. Hidrologia de
- Page 122 and 123: de Geografia da Unemat, 10. (SEMAGE
- Page 124 and 125: BORSATO, F.; MARTONI, A. Estudo da
- Page 126 and 127: %20Cardoso%20Neto/Introducao_a_dren