

caracterização ambiental e hidrológa da bacia do córrego ... - Index of
caracterização ambiental e hidrológa da bacia do córrego ... - Index of
caracterização ambiental e hidrológa da bacia do córrego ... - Index of

You also want an ePaper? Increase the reach of your titles
YUMPU automatically turns print PDFs into web optimized ePapers that Google loves.
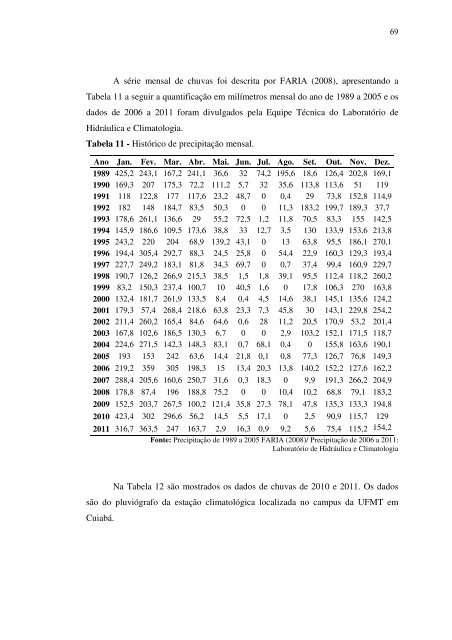
A série mensal de chuvas foi descrita por FARIA (2008), apresentan<strong>do</strong> a<br />
Tabela 11 a seguir a quantificação em milímetros mensal <strong>do</strong> ano de 1989 a 2005 e os<br />
<strong>da</strong><strong>do</strong>s de 2006 a 2011 foram divulga<strong>do</strong>s pela Equipe Técnica <strong>do</strong> Laboratório de<br />
Hidráulica e Climatologia.<br />
Tabela 11 - Histórico de precipitação mensal.<br />
Ano Jan. Fev. Mar. Abr. Mai. Jun. Jul. Ago. Set. Out. Nov. Dez.<br />
1989 425,2 243,1 167,2 241,1 36,6 32 74,2 195,6 18,6 126,4 202,8 169,1<br />
1990 169,3 207 175,3 72,2 111,2 5,7 32 35,6 113,8 113,6 51 119<br />
1991 118 122,8 177 117,6 23,2 48,7 0 0,4 29 73,8 152,8 114,9<br />
1992 182 148 184,7 83,5 50,3 0 0 11,3 183,2 199,7 189,3 37,7<br />
1993 178,6 261,1 136,6 29 55,2 72,5 1,2 11,8 70,5 83,3 155 142,5<br />
1994 145,9 186,6 109,5 173,6 38,8 33 12,7 3,5 130 133,9 153,6 213,8<br />
1995 243,2 220 204 68,9 139,2 43,1 0 13 63,8 95,5 186,1 270,1<br />
1996 194,4 305,4 292,7 88,3 24,5 25,8 0 54,4 22,9 160,3 129,3 193,4<br />
1997 227,7 249,2 183,1 81,8 34,3 69,7 0 0,7 37,4 99,4 160,9 229,7<br />
1998 190,7 126,2 266,9 215,3 38,5 1,5 1,8 39,1 95,5 112,4 118,2 260,2<br />
1999 83,2 150,3 237,4 100,7 10 40,5 1,6 0 17,8 106,3 270 163,8<br />
2000 132,4 181,7 261,9 133,5 8,4 0,4 4,5 14,6 38,1 145,1 135,6 124,2<br />
2001 179,3 57,4 268,4 218,6 63,8 23,3 7,3 45,8 30 143,1 229,8 254,2<br />
2002 211,4 260,2 165,4 84,6 64,6 0,6 28 11,2 20,5 170,9 53,2 201,4<br />
2003 167,8 102,6 186,5 130,3 6,7 0 0 2,9 103,2 152,1 171,5 118,7<br />
2004 224,6 271,5 142,3 148,3 83,1 0,7 68,1 0,4 0 155,8 163,6 190,1<br />
2005 193 153 242 63,6 14,4 21,8 0,1 0,8 77,3 126,7 76,8 149,3<br />
2006 219,2 359 305 198,3 15 13,4 20,3 13,8 140,2 152,2 127,6 162,2<br />
2007 288,4 205,6 160,6 250,7 31,6 0,3 18,3 0 9,9 191,3 266,2 204,9<br />
2008 178,8 87,4 196 188,8 75,2 0 0 10,4 10,2 68,8 79,1 183,2<br />
2009 152,5 203,7 267,5 100,2 121,4 35,8 27,3 78,1 47,8 135,3 133,3 194,8<br />
2010 423,4 302 296,6 56,2 14,5 5,5 17,1 0 2,5 90,9 115,7 129<br />
2011 316,7 363,5 247 163,7 2,9 16,3 0,9 9,2 5,6 75,4 115,2 154,2<br />
Fonte: Precipitação de 1989 a 2005 FARIA (2008)/ Precipitação de 2006 a 2011:<br />
Laboratório de Hidráulica e Climatologia<br />
Na Tabela 12 são mostra<strong>do</strong>s os <strong>da</strong><strong>do</strong>s de chuvas de 2010 e 2011. Os <strong>da</strong><strong>do</strong>s<br />
são <strong>do</strong> pluviógrafo <strong>da</strong> estação climatológica localiza<strong>da</strong> no campus <strong>da</strong> UFMT em<br />
Cuiabá.<br />
69