

Turkish Journal of Hematology Volume: 31 - Issue: 2

You also want an ePaper? Increase the reach of your titles
YUMPU automatically turns print PDFs into web optimized ePapers that Google loves.
Turk J Hematol 2014;<strong>31</strong>:121-127<br />
Atalay F, et al: sEPCR Levels and Thromboembolism in CMPD<br />
<strong>of</strong> cerebrovascular incidents was 12% (n=3) and the<br />
prevalence <strong>of</strong> thromboembolic incidents was 44% (n=11).<br />
Arterial thromboses were detected in the majority <strong>of</strong> the<br />
patients (32%, n=8) who developed thrombosis. Most<br />
<strong>of</strong> these were cerebral (24%, n=6) or involved the lower<br />
extremities (8%, n=2), abdomen (8%, n=2), or coronary<br />
artery (4%, n=1). Four (16%) <strong>of</strong> the patients who had<br />
been receiving antiaggregant therapy developed a second<br />
attack, mostly in the form <strong>of</strong> a cranial thromboembolic<br />
event (Table 2). In terms <strong>of</strong> thromboembolic episodes and<br />
the number, location, and type <strong>of</strong> thromboses, there was<br />
no statistically significant difference between patients with<br />
ET and PV. Erythromelalgia was found in 2 <strong>of</strong> the patients<br />
with ET, and signs <strong>of</strong> hyperviscosity were observed in 5<br />
<strong>of</strong> the patients with ET. Hypermetabolic symptoms were<br />
present in 38.5% <strong>of</strong> the patients. There was no statistically<br />
significant difference between the patients with ET<br />
and PV in terms <strong>of</strong> the history <strong>of</strong> and the number <strong>of</strong><br />
thromboembolic attacks, or in the type and localization <strong>of</strong><br />
thrombosis (Table 2).<br />
Comparing the patients with and without a history<br />
<strong>of</strong> thromboembolic attack, no statistically significant<br />
difference was observed in the sEPCR, D-dimer, TAT, F1+2,<br />
and hematocrit levels (p=0.<strong>31</strong>8, p=0.722, p=0.743, p=0.324,<br />
and p=0.065, respectively). However, the difference in the<br />
leukocyte and platelet counts was statistically significant<br />
(p=0.010 and p=0.027, respectively) (Table 3).<br />
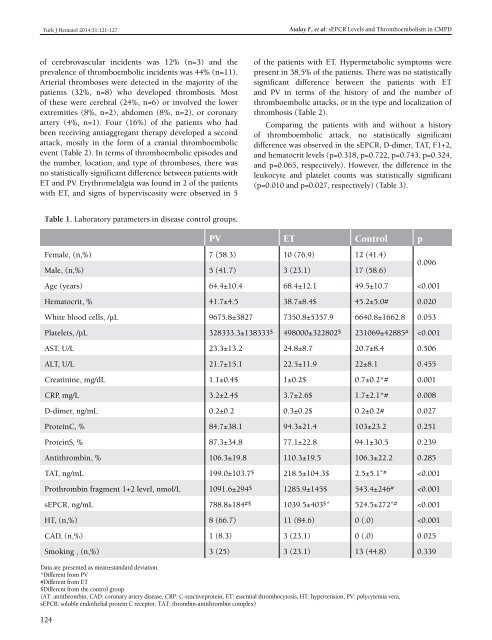
Table 1. Laboratory parameters in disease control groups.<br />
PV ET Control p<br />
Female, (n,%) 7 (58.3) 10 (76.9) 12 (41.4)<br />
Male, (n,%) 5 (41.7) 3 (23.1) 17 (58.6)<br />
0.096<br />
Age (years) 64.4±10.4 68.4±12.1 49.5±10.7


