

Turkish Journal of Hematology Volume: 31 - Issue: 2

You also want an ePaper? Increase the reach of your titles
YUMPU automatically turns print PDFs into web optimized ePapers that Google loves.
El-Menshawy N, et al: Clinical Significance <strong>of</strong> LYL1 Gene Expression<br />
Turk J Hematol 2014;<strong>31</strong>:128-135<br />
and immunophenotyping studies <strong>of</strong> the marrow samples<br />
to confirm the specific clonality and correlation with<br />
morphological French-American-British (FAB) classification.<br />
Patient characteristics are given in Table 1.<br />
Analysis <strong>of</strong> LYL1 Expression by Real-Time Polymerase<br />
Chain Reaction<br />
Sample Collection<br />
BM aspirates and venous blood samples were collected<br />
from each patient with completely aseptic techniques and<br />
under mild conscious sedation. Ten peripheral venous<br />
blood samples were obtained from the healthy controls to<br />
determine the reference level <strong>of</strong> LYL1.<br />
Analysis<br />
RNA was extracted from the blood or marrow cells using<br />
a commercial RNA isolation kit (QIAamp RNA Blood Mini<br />
Kit, QIAGEN, Hilden, Germany; Cat. No. 52304) according<br />
to the manufacturer instructions. The specificity <strong>of</strong> the<br />
LYL1 amplification was confirmed by the observation <strong>of</strong> a<br />
unimolecular dissociation curve and a single band on 3%<br />
agarose gel following electrophoresis.<br />
RNA was reverse transcribed from 1 µg <strong>of</strong> total RNA in<br />
a final volume <strong>of</strong> 20 µL containing reverse transcriptionpolymerase<br />
chain reaction (RT-PCR) buffer (1 mM each dNTP,<br />
3 mM MgCl2, 75 mM KCl, 50 mM Tris-HCL, pH 8.3), 10 U<br />
RNA (Promega, Madison, WI, USA), 100 mM dithiothreitol,<br />
100 U superscript II (Gibco-BRL, Cergy-Pontoise, France),<br />
and 25 µM random hexamers. The expression levels <strong>of</strong><br />
various target PCRs were quantified relative to the expression<br />
level <strong>of</strong> the endogenous housekeeping gene, glyceraldehyde-<br />
3-phosphate dehydrogenase (GAPDH), by real time RT-PCR<br />
in a Step-One 7000 (PE Applied Biosystems, Foster City, CA,<br />
USA) as described previously [9].<br />
For detection <strong>of</strong> LYL1 expression levels, the forward<br />
primer 5`- TCA CCC CTT CCT CAA CAG TGT- 3` and<br />
reverse primer 5`- CGG GCC ACC TTC TGG G- 3` were<br />
used in combination with the probe 5`- (FAM)- CCT TCA<br />
CAC GCC TGC AGA TC- (TAMRA) -3`. Each sample had<br />
internal endogenous controls <strong>of</strong> GAPDH forward primer 5`-<br />
GAA GGT GAA GGT CGG AGT C -3` and GAPDH reverse<br />
primer 5`- GAA GAT GGT GAT GGG ATT TC -3`.<br />
The cDNA was amplified for 40 cycles <strong>of</strong> 15 s at 95<br />
°C (denaturation) and 1 min at 60 °C (annealing and<br />
extension). The relative copy numbers <strong>of</strong> gene expression<br />
were quantified using the comparative threshold cycle (ct)<br />
method as shown in Figure 2.<br />
Statistical<br />
The data collected were statistically analyzed using<br />
SPSS 16 (SPSS Inc., Chicago, IL, USA). The Student<br />
t-test, the Mann-Whitney U test, and one-way ANOVA<br />
(t-test) were used when making comparisons between<br />
groups. Correlations among variables were found by using<br />
Spearman’s correlation coefficient and linear regression<br />
analysis. A 2-sided p value <strong>of</strong> less than 0.05 was considered<br />
significant. Qualitative data are presented as numbers<br />
and percentages. Quantitative data are presented as mean<br />
± standard deviation or median (minimum-maximum)<br />
where appropriate.<br />
Results<br />
Expression <strong>of</strong> LYL1 was studied in 22 de novo and 17<br />
high-risk AML patients. LYL1 expression levels <strong>of</strong> the 4<br />
study groups are presented in Table 1.<br />
LYL1 expression was significantly higher in comparison to<br />
controls in all 3 groups with mean values <strong>of</strong> 4.6±2.9, 6.8±2.1,<br />
and 7.3±3.1 for Groups I, II, and III, respectively (related<br />
p values were 0.008, 0.003, and 0.0011, respectively). The<br />
highest expression level was detected in MDS transformed<br />
leukemia patients (Figure 1).<br />
An increase in expression <strong>of</strong> at least 2 times the normal<br />
control was considered positive for LYL1 expression.<br />
Accordingly, positive LYL1 expression was found in 15/22<br />
(68.2%), 6/8 (75%), and 7/9 (77.8%) cases in Groups I, II,<br />
and III, respectively (Table 2, Figure 2)<br />
No significant correlation between the expression <strong>of</strong><br />
LYL1 and the hemoglobin concentration, leukocyte count,<br />
Figure 1. Interaction box plot representing expression level<br />
<strong>of</strong> LYL1 in different patient groups (p=0.000).<br />
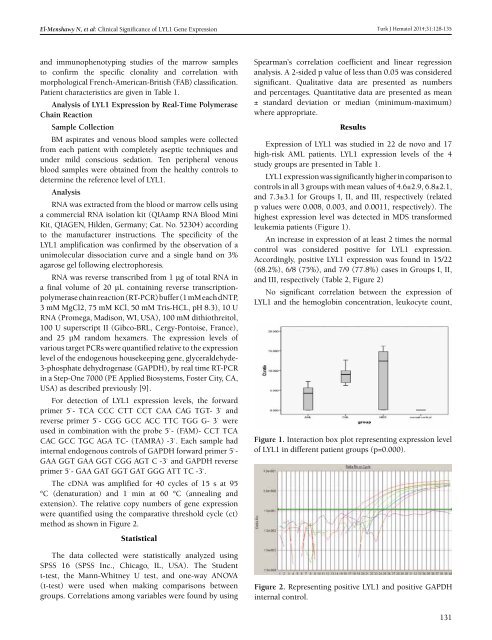
Figure 2. Representing positive LYL1 and positive GAPDH<br />
internal control.<br />
1<strong>31</strong>


