

Turkish Journal of Hematology Volume: 31 - Issue: 2

Create successful ePaper yourself
Turn your PDF publications into a flip-book with our unique Google optimized e-Paper software.
Uz B, et al: Local Renin-Angiotensin System in Multiple Myeloma<br />
Turk J Hematol 2014;<strong>31</strong>:136-142<br />
Quantitative Real-Time Polymerase Chain Reaction<br />
Analysis<br />
We searched for the gene expression <strong>of</strong> the major<br />
RAS components including RENIN, angiotensinogen<br />
(ANGTS), angiotensin converting enzyme-I (ACE I),<br />
ACE II, angiotensin receptor-I (AGTR I), and AGTR II in<br />
healthy hematopoietic cells and myeloma cells by qRT-PCR.<br />
Previously designed primer-probes were used [28]. mRNA<br />
levels were normalized to CYPA and B-ACTIN genes.<br />
The qRT-PCR analyses were performed using a<br />
LightCycler 480 instrument (Roche Diagnostics). Real-time<br />
amplification was performed with a final reaction mixture<br />
<strong>of</strong> 20 µL containing 5 µM <strong>of</strong> each primer, 0.5 µM <strong>of</strong> each<br />
probe, LightCycler 480 Probe Master Mix, and 100 ng/µL<br />
<strong>of</strong> cDNA. Each sample was studied in duplicate and all runs<br />
were repeated twice. The PCR protocol was as follows: initial<br />
denaturation at 95 °C for 7 min, and amplification segment<br />
at 5 s at 95 °C, 10 s at 60 °C, and 10 s at 72 °C for 45 cycles.<br />
The 2-Ct method was used to calculate relative expression<br />
levels determined from the qRT-PCR experiments [29] and<br />
results were given as percentages.<br />
Statistical<br />
I genes in CD34+MM cells compared to CD34+CBM cells<br />
are given in Table 1. Other RAS pathway members’ (ACE II,<br />
AGTR I, and AGTR II) expressions were also examined and<br />
were not found to be at detectable levels, and no significant<br />
differences were determined between any groups.<br />
Discussion<br />
In the present study, RENIN and ANGTS mRNA<br />
expressions were significantly higher in CD34+<br />
hematopoietic stem cells <strong>of</strong> healthy allogeneic donors in<br />
comparison to myeloma-related progenitor cells. Likewise,<br />
RENIN, ANGTS, and ACE I mRNA expression levels <strong>of</strong><br />
CBM were significantly higher than those in the myeloma<br />
patients. However, ACE I expression levels were similar in<br />
CD34+CBM and CD34+MM hematopoietic cells. These<br />
findings support our original hypothesis that there is a<br />
biologically active local RAS in the hematopoietic system in<br />
normal and pathological states [1,2].<br />
Strawn et al. previously verified in rats that all <strong>of</strong> the<br />
main RAS components, including renin, ANGTS, ACE,<br />
SPSS 15.0 (SPSS Inc., USA) was used for all statistical<br />
analyses. The results were given as mean ± standard error<br />
for the data with normal distribution, as median (min-max)<br />
for the data without a normal distribution, and as ratio for<br />
the nominal data. Data distribution was tested with the<br />
Kolmogorov-Smirnov test. Homogeneities <strong>of</strong> variances were<br />
evaluated with Levene’s test. Nonparametric tests were used<br />
since the sample sizes <strong>of</strong> the groups were small. Differences<br />
between 2 groups were assessed by the Mann-Whitney U test.<br />
A p-value <strong>of</strong> ≤0.05 was considered statistically significant.<br />
Results<br />
Patient Characteristics<br />
Five female and 4 male myeloma patients with a<br />
median age <strong>of</strong> 52 (40-62) years were recruited. Based on<br />
the International Staging System, 4 had stage I, 2 had stage<br />
II, and 2 had stage III disease. One patient could not be<br />
evaluated due to the lack <strong>of</strong> initial data.<br />
Relative mRNA Expressions <strong>of</strong> the RAS Components in<br />
the Studied Cellular Samples<br />
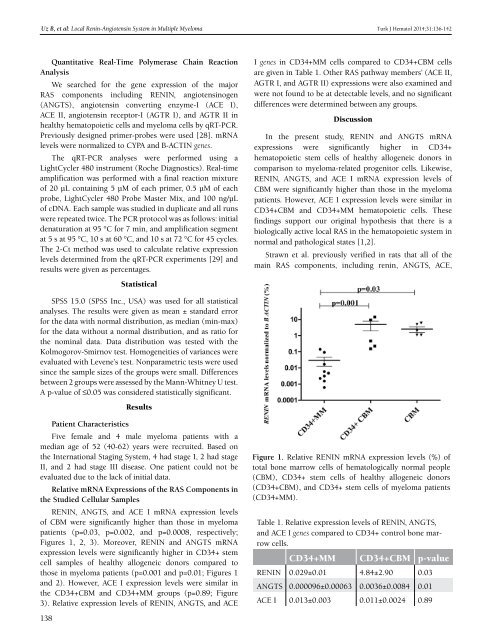
RENIN, ANGTS, and ACE I mRNA expression levels<br />
<strong>of</strong> CBM were significantly higher than those in myeloma<br />
patients (p=0.03, p=0.002, and p=0.0008, respectively;<br />
Figures 1, 2, 3). Moreover, RENIN and ANGTS mRNA<br />
expression levels were significantly higher in CD34+ stem<br />
cell samples <strong>of</strong> healthy allogeneic donors compared to<br />
those in myeloma patients (p=0.001 and p=0.01; Figures 1<br />
and 2). However, ACE I expression levels were similar in<br />
the CD34+CBM and CD34+MM groups (p=0.89; Figure<br />
3). Relative expression levels <strong>of</strong> RENIN, ANGTS, and ACE<br />
138<br />
Figure 1. Relative RENIN mRNA expression levels (%) <strong>of</strong><br />
total bone marrow cells <strong>of</strong> hematologically normal people<br />
(CBM), CD34+ stem cells <strong>of</strong> healthy allogeneic donors<br />
(CD34+CBM), and CD34+ stem cells <strong>of</strong> myeloma patients<br />
(CD34+MM).<br />
Table 1. Relative expression levels <strong>of</strong> RENIN, ANGTS,<br />
and ACE I genes compared to CD34+ control bone marrow<br />
cells.<br />
CD34+MM CD34+CBM p-value<br />
RENIN 0.029±0.01 4.84±2.90 0.03<br />
ANGTS 0.000096±0.00063 0.0036±0.0084 0.01<br />
ACE I 0.013±0.003 0.011±0.0024 0.89


