

IRIAN JAYA, INDONESIA, and NEW ZEALAND
IRIAN JAYA, INDONESIA, and NEW ZEALAND
IRIAN JAYA, INDONESIA, and NEW ZEALAND

You also want an ePaper? Increase the reach of your titles
YUMPU automatically turns print PDFs into web optimized ePapers that Google loves.
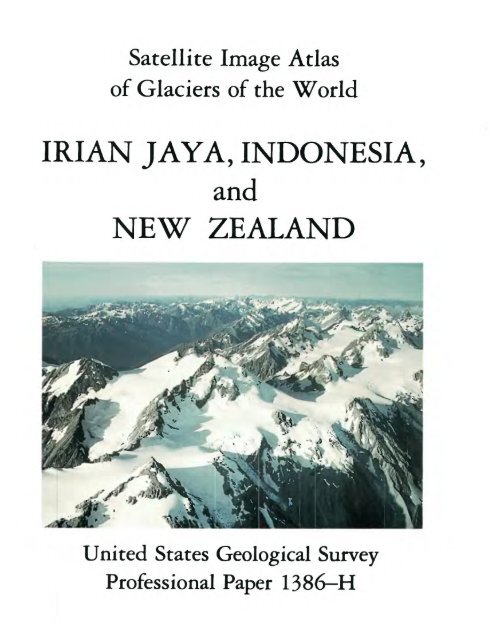
Satellite Image Atlas<br />
of Glaciers of the World<br />
<strong>IRIAN</strong> <strong>JAYA</strong>, <strong>INDONESIA</strong>,<br />
<strong>and</strong><br />
<strong>NEW</strong> <strong>ZEALAND</strong><br />
United States Geological Survey<br />
Professional Paper 1386 H
Cover: Oblique aerial photograph of the Garden of Eden<br />
<strong>and</strong> Garden of Allah ice fields in the Southern Alps, New<br />
Zeal<strong>and</strong>. See page H28.
GLACIERS OF <strong>IRIAN</strong> JAVA, <strong>INDONESIA</strong>,<br />
AND <strong>NEW</strong> <strong>ZEALAND</strong><br />
H-l. GLACIERS OF <strong>IRIAN</strong> <strong>JAYA</strong>, <strong>INDONESIA</strong><br />
£j/IAN ALLISON W JAMES A. PETERSON<br />
H-2. GLACIERS OF <strong>NEW</strong> <strong>ZEALAND</strong><br />
By TREVOR J.H. CHINN<br />
SATELLITE IMAGE ATLAS OF GLACIERS OF THE WORLD<br />
Edited by RICHARD S. WILLIAMS, Jr., <strong>and</strong> JANE G. FERRIGNO<br />
U. S. GEOLOGICAL SURVEY PROFESSIONAL PAPER 1386-H<br />
UNITED STATES GOVERNMENT PRINTING OFFICE, WASHINGTON: 1989
Library of Congress Cataloging in Publication Data<br />
(Revised for vol. 2)<br />
Satellite image atlas of glaciers of the world.<br />
U.S. DEPARTMENT OF THE INTERIOR<br />
BRUCE BABBITT, Secretary<br />
U.S. GEOLOGICAL SURVEY<br />
Gordon P. Eaton, Director<br />
Reprinted 1995<br />
Any use of trade, product, or firm names in this publication is for<br />
descriptive purposes only <strong>and</strong> does not imply endorsement by the<br />
U.S. Government<br />
(U.S. Geological Survey professional paper ; 1386)<br />
Two fold. col. maps in pocket in v. B.<br />
Includes bibliographical references.<br />
Supt. of Docs, no.: I 19.16:1386-H<br />
Contents: ch. B. Antarctica / by Charles Swithinbank ; with sections on The "dry valleys" of Victoria L<strong>and</strong>, by Trevor J.H.<br />
Chinn, [<strong>and</strong>] L<strong>and</strong>sat images of Antarctica, by Richard S. Williams, Jr., <strong>and</strong> Jane G. Ferrigno ch. H, 1. Glaciers of Irian<br />
Jaya, Indonesia / by lan Allison <strong>and</strong> James A. Peterson ch. H, 2. Glaciers of New Zeal<strong>and</strong> / by Trevor J.H. Chinn<br />
GB2401.72.R42S28 1988 551.3'12 87-600497<br />
For sale by the U.S. Geological Survey, Information Services<br />
Box 25286, Federal Center, Denver, CO 80225
Foreword<br />
On 23 July 1972, the first Earth Resources Technology Satellite<br />
(ERTS 1 or L<strong>and</strong>sat 1) was successfully placed in orbit. The success of<br />
L<strong>and</strong>sat inaugurated a new era in satisfying mankind's desire to better<br />
underst<strong>and</strong> the dynamic world upon which we live. Space-based observa<br />
tions have now become an essential means for monitoring global change.<br />
The short- or long-term cumulative effects of processes that cause<br />
significant changes on the Earth's surface can be documented <strong>and</strong><br />
studied by repetitive L<strong>and</strong>sat images. Such images provide a permanent<br />
historical record of the surface of our planet; they also make possible<br />
comparative two-dimensional measurements of change over time. This<br />
Professional Paper demonstrates the importance of the application of<br />
L<strong>and</strong>sat images to global studies by using them to determine the current<br />
distribution of glaciers on our planet. As images become available from<br />
future satellites, the new data will be used to document global changes in<br />
glacier extent by reference to the image record of the 1970's.<br />
Although many geological processes take centuries or even millenia to<br />
produce obvious changes on the Earth's surface, other geological<br />
phenomena, such as glaciers <strong>and</strong> volcanoes, cause noticeable changes<br />
over shorter periods. Some of these phenomena can have a worldwide<br />
impact <strong>and</strong> often are interrelated. Explosive volcanic eruptions can pro<br />
duce dramatic effects on the global climate. Natural or culturally in<br />
duced processes can cause global climatic cooling or warming. Glaciers<br />
respond to such warming or cooling periods by decreasing or increasing<br />
in size, thereby causing sea level to rise or fall.<br />
As our underst<strong>and</strong>ing of the interrelationship of global processes im<br />
proves <strong>and</strong> our ability to assess changes caused by these processes<br />
develops further, we will learn how to use indicators of global change,<br />
such as glacier variation, to more wisely manage the use of our finite<br />
l<strong>and</strong> <strong>and</strong> water resources. This Professional Paper is an excellent exam<br />
ple of the way in which we can use technology to provide needed earth-<br />
science information about our planet. The international collaboration<br />
represented by this report is also an excellent model for the kind of<br />
cooperation that scientists will increasingly find necessary in the future<br />
in order to solve important earth-science problems on a global basis.<br />
Dallas L. Peck<br />
Director,<br />
U.S. Geological Survey<br />
FOREWORD III
Preface<br />
This chapter is 1 in a series of 11 that comprise U.S. Geological<br />
Survey Professional Paper 1386, Satellite Image Atlas of Glaciers of the<br />
World, which is directed at the use of remotely sensed images, primarily<br />
from the L<strong>and</strong>sat 1, 2, <strong>and</strong> 3 series of spacecraft, to document, monitor,<br />
<strong>and</strong> study the glacierized regions of our planet. Although L<strong>and</strong>sat 1, 2,<br />
<strong>and</strong> 3 multispectral scanner (MSS) <strong>and</strong> L<strong>and</strong>sat 3 return beam vidicon<br />
(RBV) images are especially well suited to studying changes in the Ant<br />
arctic ice sheet (Chapter B), the Greenl<strong>and</strong> ice sheet (Chapter C), <strong>and</strong> ice<br />
caps <strong>and</strong> (or) ice fields in Icel<strong>and</strong> (Chapter D), Europe (Chapter E), Asia<br />
(Chapter F), South America (Chapter I), <strong>and</strong> North America (Chapter J),<br />
the images can also be used, in conjunction with maps, aerial<br />
photographs, <strong>and</strong> field measurements, to study <strong>and</strong> monitor changes in<br />
smaller glaciers on high mountains at lower latitudes, if the glaciers<br />
reach a size of a few kilometers (length or diameter).<br />
In Irian Jaya, Indonesia, three small perennial ice fields are located on<br />
Puncak Jaya massif, Puncak M<strong>and</strong>ala, <strong>and</strong> Ngga Pilimsit in the Central<br />
Range. The largest ice field, on Puncak Jaya massif, has an area of ap<br />
proximately 7 km2 . All three ice fields have experienced rapid retreat<br />
during the 20th century, a situation that has been documented at other<br />
equatorial glaciers in Africa (Chapter G) <strong>and</strong> South America (Chapter I).<br />
L<strong>and</strong>sat images were combined with field observations to locate,<br />
delineate, <strong>and</strong> monitor changes in the ice field.<br />
In New Zeal<strong>and</strong>, approximately 3,155 glaciers occur along the crest of<br />
the Southern Alps, South Isl<strong>and</strong>, <strong>and</strong> 6 glaciers are present on Mount<br />
Ruapehu, North Isl<strong>and</strong>. The total area covered is about 1,159 km2 , with<br />
an estimated volume of 53.3 km3 . In 1859, the first observations were<br />
made of New Zeal<strong>and</strong>'s glaciers; in 1889, the first precise measurements<br />
were carried out, although modern glaciological studies were not begun<br />
until the 1950's. Because of limitations in spatial resolution of the sensors,<br />
L<strong>and</strong>sat images were found to be useful only for monitoring changes in<br />
the largest glaciers <strong>and</strong> in the position of the transient snowline.<br />
Richard S. Williams, Jr.<br />
Jane G. Ferrigno,<br />
Editors<br />
PREFACE V
About this Volume<br />
U.S. Geological Survey Professional Paper 1386, Satellite Image Atlas<br />
of Glaciers of the World, contains eleven chapters designated by the let<br />
ters A through K. Chapter A is a general chapter containing introduc<br />
tory material <strong>and</strong> a discussion of the physical characteristics, classifica<br />
tion, <strong>and</strong> global distribution of glaciers. The next nine chapters, B<br />
through J, are arranged geographically <strong>and</strong> present glaciological infor<br />
mation from L<strong>and</strong>sat <strong>and</strong> other sources of data on each of the<br />
geographic areas. Chapter B covers Antarctica; Chapter C, Greenl<strong>and</strong>;<br />
Chapter D, Icel<strong>and</strong>; Chapter E, Continental Europe (except for the<br />
European part of the Soviet Union), including the Alps, the Pyrenees,<br />
Norway, Sweden, Svalbard (Norway), <strong>and</strong> Jan Mayen (Norway);<br />
Chapter F, Asia, including the European part of the Soviet Union, China<br />
(P.R.C.), India, Nepal, Afghanistan, <strong>and</strong> Pakistan; Chapter G, Turkey,<br />
Iran, <strong>and</strong> Africa; Chapter H, Irian Jaya (Indonesia) <strong>and</strong> New Zeal<strong>and</strong>;<br />
Chapter I, South America; <strong>and</strong> Chapter J, North America. The final<br />
chapter, K, is a topically oriented chapter that presents related<br />
glaciological topics.<br />
The realization that one element of the Earth's cryosphere, its<br />
glaciers, was amenable to global inventorying <strong>and</strong> monitoring with<br />
L<strong>and</strong>sat images led to the decision, in late 1979, to prepare this Profes<br />
sional Paper, in which L<strong>and</strong>sat 1, 2, <strong>and</strong> 3 multispectral scanner (MSS)<br />
<strong>and</strong> L<strong>and</strong>sat 2 <strong>and</strong> 3 return beam vidicon (RBV) images would be used to<br />
inventory the areal occurrence of glacier ice on our planet within the<br />
boundaries of the spacecraft's coverage (between about 81° north <strong>and</strong><br />
south latitudes). Through identification <strong>and</strong> analysis of optimum L<strong>and</strong>-<br />
sat images of the glacierized areas of the Earth during the first decade of<br />
the L<strong>and</strong>sat era, a global benchmark could be established for determin<br />
ing the areal extent of glaciers during a relatively narrow time interval<br />
(1972 to 1982). This global "snapshot" of glacier extent could then be<br />
used for comparative analysis with previously published maps <strong>and</strong> aerial<br />
photographs <strong>and</strong> with new maps, satellite images, <strong>and</strong> aerial pho<br />
tographs to determine the areal fluctuation of glaciers in response to<br />
natural or culturally induced changes in the Earth's climate.<br />
To accomplish this objective, the editors selected optimum L<strong>and</strong>sat<br />
images of each of the glacierized regions of our planet from the L<strong>and</strong>sat<br />
image data base at the EROS Data Center in Sioux Falls, South Dakota,<br />
although some images were also obtained from the L<strong>and</strong>sat image ar<br />
chives maintained by the Canada Centre for Remote Sensing, Ottawa,<br />
Ontario, Canada, <strong>and</strong> by the European Space Agency in Kiruna,<br />
Sweden, <strong>and</strong> Fucino, Italy. Between 1979 <strong>and</strong> 1981, these optimum<br />
images were distributed to an international team of more than 50 scien<br />
tists who agreed to author a section of the Professional Paper concern<br />
ing either a geographic area or a glaciological topic. In addition to<br />
analyzing images of a specific geographic area, each author was also<br />
asked to summarize up-to-date information about the glaciers within the<br />
area <strong>and</strong> to compare their present areal distribution with historical infor<br />
mation (for example, from published maps, reports, photographs, etc.)<br />
about their past extent. Completion of this atlas will provide an accurate<br />
regional inventory of the areal extent of glaciers on our planet during<br />
the 1970's.<br />
VI ABOUT THIS VOLUME<br />
Richard S. Williams, Jr.<br />
Jane G. Ferrigno,<br />
Editors
CONTENTS<br />
Page<br />
Foreword ________________________________ III<br />
Preface _________________________________ V<br />
About this volume ___________________________ VI<br />
H-l. Glaciers of Irian Jaya, Indonesia, by lan Allison <strong>and</strong> James<br />
A. Peterson _________________________ HI<br />
H-2. Glaciers of New Zeal<strong>and</strong>, by Trevor J.H. Chinn ______ H21<br />
CONTENTS VII
Glaciers of Irian Jaya, Indonesia,<br />
<strong>and</strong> New Zeal<strong>and</strong><br />
GLACIERS OF <strong>IRIAN</strong> <strong>JAYA</strong>, <strong>INDONESIA</strong><br />
BylAN ALLISON<strong>and</strong> JAMES A. PETERSON<br />
SATELLITE IMAGE ATLAS OF GLACIERS OF THE WORLD<br />
Edited by RICHARD S. WILLIAMS, Jr., <strong>and</strong> JANE G. FERRIGNO<br />
U. S. GEOLOGICAL SURVEY PROFESSIONAL PAPER 1386-H-l<br />
L<strong>and</strong>sat images, in conjunction with<br />
aerial photographs <strong>and</strong> field<br />
measurements, were used to locate,<br />
describe, <strong>and</strong> monitor changes in<br />
the three ice fields in the Central<br />
Range of Irian Jaya<br />
UNITED STATES GOVERNMENT PRINTING OFFICE, WASHINGTON : 1989
CONTENTS<br />
Glaciers of Irian Jaya, Indonesia ___________________ HI<br />
Abstract ________________________________ 1<br />
Introduction ______________________________ 1<br />
FIGURE 1. Index map of Irian Jaya showing the location of the highest<br />
mountains ______________________________ 2<br />
2. Map of the ice fields of the Puncak Jaya area showing retreat of the<br />
ice boundaries since about 1800 to 1850 A.D. _________ 4<br />
3. Oblique aerial photograph looking east at several of the glaciers<br />
on Puncak Jaya __________________________ 6<br />
Glacier imagery <strong>and</strong> mapping _____________________ 7<br />
Aerial photography ______________________ 7<br />
Maps of the Puncak Jaya region <strong>and</strong> of the glacier<br />
recession _________________________ 10<br />
Satellite imagery _______________________ 10<br />
FIGURE 4. Mosaic of U.S. Army Air Force vertical aerial photographs of the<br />
Northwall Firn in 1942 ______________________ 7<br />
5. U.S. Army Air Force trimetrogon oblique aerial photograph looking<br />
south at the glaciers in 1942 __________________ 8<br />
6. Oblique aerial photograph looking east at the glaciers in 1972 __ 9<br />
7. Index map to the optimum L<strong>and</strong>sat 1, 2, <strong>and</strong> 3 images of the<br />
glaciers of Irian Jaya ______________________ 11<br />
TABLE 1. Optimum L<strong>and</strong>sat 1, 2, <strong>and</strong> 3 images of the glaciers of Irian<br />
Jaya _______________________________ 12<br />
Observation <strong>and</strong> mapping of the glaciers shown on L<strong>and</strong>sat images 13<br />
Puncak Jaya <strong>and</strong> Ngga Pilimsit ____________ _ 13<br />
Puncak M<strong>and</strong>ala _______________________ 18<br />
FIGURE 8. L<strong>and</strong>sat 1 image showing the ice fields of the Puncak Jaya<br />
region ________________________________ 14<br />
9. Oblique aerial photograph looking east at the Ngga Pilimsit ice cap<br />
in 1972 _______________________________ 15<br />
10. An approximately 1:275,000-scale enlargement of part of a L<strong>and</strong>sat 1<br />
image showing the Puncak Jaya glaciers <strong>and</strong> Ngga Pilimsit _ 15<br />
11. Thematic sketch map showing satellite-derived boundary of Puncak<br />
Jaya glaciers in 1974 compared with the 1972 CGE boundary _ 16<br />
TABLE 2. Ice areas in the Puncak Jaya region _________________ 18<br />
Changes in the Puncak Jaya glaciers, 1974 to 1983 ______ 19<br />
Conclusion _______________________________ 19<br />
Acknowledgments ___________________________ 19<br />
References cited _________________________ 20<br />
CONTENTS XI
SATELLITE IMAGE ATLAS OF GLACIERS OF THE WORLD<br />
GLACIERS OF <strong>IRIAN</strong> <strong>JAYA</strong>, <strong>INDONESIA</strong>,<br />
AND <strong>NEW</strong> <strong>ZEALAND</strong>-<br />
GLACIERS OF <strong>IRIAN</strong> <strong>JAYA</strong>, <strong>INDONESIA</strong><br />
By 1AN ALLISON 1 <strong>and</strong> JAMES A. PETERSON2<br />
Abstract<br />
Three small perennial ice fields with a total area of about 7.5 ±0.5 km2 are situated on<br />
Puncak Jaya massif, Puncak M<strong>and</strong>ala, <strong>and</strong> Ngga Pilimsit in the Central Range of Irian<br />
Jaya. The largest of these is the one on Puncak Jaya massif with an area of about 7 km2 .<br />
The other ice fields each have a diameter of only several hundred meters. All the ice fields<br />
have experienced extensive <strong>and</strong> rapid retreat during this century. L<strong>and</strong>sat imagery has<br />
been used in conjunction with field measurements to locate, describe, <strong>and</strong> monitor changes<br />
in the ice fields.<br />
Introduction<br />
The high peaks of the 2,500-km-long Pegunungan Maoke 3 or Central<br />
Range, of equatorial New Guinea presently support glaciers in three ice<br />
areas, all of which are in the Indonesian territory of Irian Jaya: the Pun<br />
cak Jaya massif (Carstensz; 4°05'S., 137°11'E.; 4,884 m), Puncak Man<br />
dala (Julianatop; 4°48'S., 140°20'E.; 4,640 m), <strong>and</strong> Ngga Pilimsit<br />
(Idenburg-top; 4°03'S., 137°02'E.; 4,717 m) (fig. 1). An ice cap on Pun<br />
cak Trikora (Wilhelmina-top; 4°15'S., 138°45'E.; 4,730 m) disappeared<br />
sometime between 1939 <strong>and</strong> 1962. The extensive retreat of all these<br />
glaciers, which has occurred during this century, has been documented<br />
by Mercer (1967) <strong>and</strong> by Peterson <strong>and</strong> others (1973).<br />
The largest of these ice-covered areas, on the massif dominated by<br />
Puncak Jaya, totals about 7 km2 . This area was studied in some detail by<br />
two Australian Universities' Carstensz Glaciers Expeditions (CGE), <strong>and</strong><br />
the ice area <strong>and</strong> their recent history of retreat are described by Allison<br />
<strong>and</strong> Peterson (1976). The glaciers are situated atop a ridge of folded Ter<br />
tiary limestone, the axis of which trends west-northwest to east-<br />
southeast, <strong>and</strong> can be divided into four main ice masses (fig. 2): the<br />
Northwall Firn (separated into three parts by 1972), the Meren Glacier,<br />
the Carstensz Glacier (plus the small niche glaciers, the Wollaston <strong>and</strong><br />
'Australian Antarctic Division, Channel Highway, Kingston. Tasmania 7050, Australia.<br />
2Department of Geography, Monash University. Wellington Road, Clayton, Victoria 3168, Australia.<br />
3The names used are those approved by the I'. S. Board of Geographic Names <strong>and</strong> published by Garren<br />
<strong>and</strong> others (1982). In the case of glaciers <strong>and</strong> other geographic features where there is no officially ap<br />
proved name, the name generally accepted in the glaciological literature has been used.<br />
GLACIERS OF <strong>IRIAN</strong> <strong>JAYA</strong>, <strong>INDONESIA</strong> HI
8°S<br />
Seram<br />
Kepulauan<br />
Tanimbar<br />
132°E<br />
Waigeo _________ EQUATOR<br />
Figure 1. Index map of Irian Jaya show<br />
ing the location of the highest mountains<br />
(after fig. 1 in Peterson <strong>and</strong> others, 1973).<br />
Ngga Pilimsit<br />
(Idenburg-top)<br />
4717m<br />
Kepulauan Aru<br />
Arafura Sea<br />
H2 SATELLITE IMAGE ATLAS OF GLACIERS OF THE WORLD<br />
136°E 140°E<br />
PACIFIC OCEAN<br />
<strong>IRIAN</strong> JAVA<br />
MM<br />
PuncakTrikora<br />
(Wilhelmina-top)<br />
4730m<br />
Puncak M<strong>and</strong>ala<br />
(Julianatop)<br />
4640 m<br />
100 200 300 400 500 KILOMETERS<br />
I
Van de Water, which descend from the same firn field), <strong>and</strong> the<br />
Southwall Hanging Glaciers. Details of these ice masses are tabulated by<br />
Miiller (1977).<br />
The Meren <strong>and</strong> Carstensz Glaciers flow westward in parallel glacial<br />
valleys, the Meren Valley <strong>and</strong> Yellow Valley, respectively (figs. 2, 3). In<br />
1972, the Meren Glacier had an area of 1.9 km2 , a mean thickness of 40<br />
m, <strong>and</strong> measured surface velocities of up to 30 m a -1 ; the Carstensz<br />
Glacier had an area of 0.9 km2 , a mean thickness of 38 m, <strong>and</strong> measured<br />
surface velocities of up to 18 m a -1 . The morphology <strong>and</strong> dynamics of<br />
both these glaciers are described by Allison (1975 <strong>and</strong> 1976).<br />
Seasonal climatic variations on the Puncak Jaya massif are very slight.<br />
Monthly mean temperatures vary by less than 0.5 °C during the year,<br />
<strong>and</strong> there appears to be no marked seasonal variation in precipitation,<br />
radiation, or cloud cover (Allison <strong>and</strong> Bennett, 1976). As a consequence,<br />
the net balance of the glaciers remains seasonally uniform, <strong>and</strong> ablation<br />
occurs year round below the equilibrium line; above the equilibrium line<br />
accumulation occurs year round. Hence the snowline elevation on the<br />
glacier remains near the equilibrium-line altitude except for short<br />
periods after heavy snowfalls. Mass-balance measurements in 1972 in<br />
dicated an equilibrium-line altitude of 4,580 m with the net annual bal<br />
ance reaching + 1 m a -1 water equivalent (w.e.) at 4,800 m elevation,<br />
near the top of the glaciers, <strong>and</strong> - 5 m a- 1 w.e. at 4,400 m, near the ter<br />
mini. Because ablation occurs throughout the year in the ablation zone,<br />
the vertical budget gradient (activity index) for these glaciers is high.<br />
Both the Meren <strong>and</strong> Carstensz Glaciers had a negative mass budget in<br />
1972, which is consistent with their observed retreat.<br />
The ice extent on the Puncak Jaya massif is small, but the area is one<br />
of only a few present-day, ice-covered equatorial regions. The rapid <strong>and</strong><br />
continuing retreat of the glaciers during this century indicates that the<br />
mass budget has been consistently negative. This suggests a climatic<br />
change, of which the glaciers are a sensitive indicator. Using a numerical<br />
model of the glaciers <strong>and</strong> their dynamics, Allison <strong>and</strong> Kruss (1977)<br />
estimated the change in mass budget necessary to give the observed<br />
retreat, between about 1850 <strong>and</strong> 1972, of more than 2 km for the<br />
Carstensz <strong>and</strong> more than 3 km for the Meren Glacier. They showed that<br />
a steady rise of the equilibrium-line elevation at a rate of 80 m per cen<br />
tury allowed the model to match the observed retreat <strong>and</strong> that the most<br />
likely explanation for the mass-balance change was a warming of the<br />
regional air temperature by 0.6 °C per century.<br />
Subsequent observations show that the terminus of the Meren Glacier<br />
retreated about 200 m between 1973 <strong>and</strong> 1976 <strong>and</strong> that the Carstensz<br />
Glacier retreated 50 m during the same period of time (Dr. L. Hansen,<br />
pers. commun.). Continued monitoring of the glaciers is obviously<br />
needed because of the climatic implications.<br />
Far less, however, is known about the other glaciers in Irian Jaya. The<br />
ice caps on Ngga Pilimsit (about 12 km northwest of Puncak Jaya) <strong>and</strong><br />
on Puncak M<strong>and</strong>ala each have a diameter of only several hundred meters<br />
(Mercer, 1967; Peterson <strong>and</strong> others, 1973).<br />
GLACIERS OF <strong>IRIAN</strong> <strong>JAYA</strong>, <strong>INDONESIA</strong> H3
1800-<br />
1850 A.D.<br />
1936<br />
1942<br />
1962<br />
1972<br />
1972<br />
1974<br />
Known Approximate<br />
500<br />
Last neoglacial advance<br />
(retreat from which began<br />
1800-1850 A.D.)<br />
CGE field study <strong>and</strong> sketched from<br />
oblique aerial photographs<br />
Plotted after survey of cairns left by<br />
Dozy <strong>and</strong> sketched from photographs<br />
of the Colijn Expedition (Dozy, 1938)<br />
Photogrammetric plot from USAF<br />
trimetrogon aerial photographs:<br />
ground control by CGE survey<br />
Plotted after survey of cairns left by<br />
H. Harrer, <strong>and</strong> sketched from photo<br />
graphs by expedition members<br />
CGE field survey <strong>and</strong> aerial oblique<br />
photographs<br />
Ice divides<br />
Measured <strong>and</strong> sketched by R. Milton<br />
(pers. comm.)<br />
1000 METERS<br />
H4 SATELLITE IMAGE ATLAS OF GLACIERS OF THE WORLD<br />
\<br />
Grid: 5OO m intervals of an arbitrary plane grid with<br />
false origin 1O,OOO m south <strong>and</strong> 2O,OOO m west of<br />
station MG
Southwall Hanging Glaciers<br />
Carstensz Glacier<br />
Figure 2. Map of the ice fields of the<br />
Puncak Jaya area showing retreat of the<br />
ice boundaries since about 1800 to 1850<br />
A.D. (from 1:20,000-scale Australian<br />
Universities' Carstensz Glaciers Expedi<br />
tions).<br />
GLACIERS OF <strong>IRIAN</strong> <strong>JAYA</strong>, <strong>INDONESIA</strong> H5
H6 SATELLITE IMAGE ATLAS OF GLACIERS OF THE WORLD<br />
Figure 3. Oblique aerial photograph<br />
looking east at several of the glaciers on<br />
Puncak Jay a in 1936. Left to right: North-<br />
wall Firn, Merer Glacier, <strong>and</strong> Carstensz<br />
Glacier. Photograph no. S.136 by J.J.<br />
Dozy.
Figure 4. Mosaic of U.S. Army Air Force<br />
vertical aerial photographs of the North-<br />
wall Firn in 1942.<br />
Glacier Imagery <strong>and</strong> Mapping<br />
Aerial Photography<br />
Because of the area's remoteness <strong>and</strong> the persistent cloud cover, the<br />
available aerial photography of the Irian Jaya glaciers is limited. Before<br />
1975. the only vertical aerial photographs of the Puncak Jaya glaciers<br />
were obtained in 1942 during an aerial survey, with a trimetrogon<br />
camera, by the United States Army Air Force (USAAF). Most of the<br />
Northwall Firn is covered in three vertical frames acquired along one<br />
flight line of this survey (USAAF photograph no. 4 CS-5MC20-23V,<br />
frames 117 to 119, fig. 4), but the two major valley glaciers (the Meren<br />
<strong>and</strong> the Carstensz), the western end of the Northwall Firn, <strong>and</strong> Ngga<br />
Pilimsit are covered only by the trimetrogon oblique aerial photographs<br />
(USAAF photograph nos. 23R-119 (fig. 5), 23L-117, <strong>and</strong> 23L-113,<br />
respectively). The ice fields on the south wall are not covered by this<br />
flight line.<br />
More recent medium altitude (up to 11,500 m), vertical aerial<br />
photographs of the region were obtained during combined Indonesian<br />
<strong>and</strong> Australian military mapping operations between 1976 <strong>and</strong> 1981.<br />
Photographs V2F-RAAF-8466, Run 19E, frames 190-194, September<br />
1976. cover the Northwall Firn only, while photographs V2F-RAAF-<br />
9922, Run 0022, frames 9147 <strong>and</strong> 9148, January 1981, give complete<br />
coverage of the glaciers on the massif but were taken after a snowfall,<br />
which makes determination of the ice margins difficult.<br />
Data on the reduction of the total glaciated area on the Puncak Jaya<br />
massif come mostly from oblique aerial photographs. These include<br />
those taken during the 1936 Colijn Expedition (Dozy, 1938; Mercer,<br />
1967) (see fig. 3), during the 1971/72 CGE (fig. 6), <strong>and</strong> during occasional<br />
light aircraft overflights of the area. The rapid retreat of the Puncak<br />
Jaya glaciers is shown dramatically by comparing figure 3 with figure 6.<br />
Reports of changes of the ice caps on Ngga Pilimsit <strong>and</strong> Puncak Man-<br />
dala have been based on oblique aerial photography <strong>and</strong> some ground-<br />
based observations (Mercer, 1967; Peterson <strong>and</strong> others, 1973).<br />
GLACIERS OF <strong>IRIAN</strong> <strong>JAYA</strong>, <strong>INDONESIA</strong> H7
H8 SATELLITE IMAGE ATLAS OF GLACIERS OF THE WORLD<br />
Figure 5. U.S. Army Air Force trimetrogon<br />
oblique aerial photograph looking south at<br />
the glaciers in 1942. Foreground, Northwall<br />
Firn; center, Meren Glacier; background,<br />
Carstensz Glacier.
Figure 6.- Oblique aerial photograph look<br />
ing east at the glaciers in 1972. Photograph<br />
acquired during the Carstensz Glaciers Ex<br />
peditions (CGE). Compare with figure 3.<br />
Left to right: Northwall Firn, Meren Glacier,<br />
<strong>and</strong> Carstensz Glacier.<br />
GLACIERS OF <strong>IRIAN</strong> <strong>JAYA</strong>, <strong>INDONESIA</strong> H9
Maps of the Puncak Jaya Region <strong>and</strong> of the Glacier Recession<br />
The largest-scale map of the Puncak Jaya glacier area is a<br />
l:20,000-scale topographic map, produced by the CGE from the 1971 to<br />
1973 ground survey <strong>and</strong> photogrammetry of the 1942 USAAF vertical<br />
aerial photographs (using CGE ground control) (Anderson, 1976). The<br />
contour interval over most of this map is 50 m, with a 10-m contour in<br />
terval on the Carstensz <strong>and</strong> Meren Glaciers.<br />
The ice limits at different times, as shown in figure 2, are based on this<br />
map. The reliability of the ice limits is indicated in the explanation. While<br />
the reliability is generally good at the snouts of the Meren <strong>and</strong> Carstensz<br />
Glaciers, the eastern <strong>and</strong> southern ice boundaries are based only on un<br />
controlled oblique aerial photographs.<br />
A small-scale map (1:250,000) was used by the CGE to delineate the<br />
maximum extent of the last Pleistocene (Wisconsinan, or Wurm) glacia-<br />
tion. This map was based on the 1:250,000-scale Joint Operations<br />
Graphic Series 1501, Sheets SB53-4 <strong>and</strong> SB53-16, with corrections<br />
made to the drainage net from field observations. The glacial geology<br />
features (morainal ridges, glaciated headwalls, <strong>and</strong> probable maximum<br />
extent of glaciation) were mapped from the 1942 USAAF trimetrogon<br />
oblique aerial photographs <strong>and</strong> field reconnaissance by the CGE <strong>and</strong><br />
others (Hope <strong>and</strong> Peterson, 1976).<br />
Satellite Imagery<br />
The inaccessibility of the region for both conventional <strong>and</strong> aerial<br />
surveys makes monitoring of the glaciers by satellite a particularly at<br />
tractive proposition. Because the largest of the glaciers on Puncak Jaya<br />
covers less than 7 km2 , only the L<strong>and</strong>sat series of spacecraft has offered<br />
sufficient resolution for mapping even gross changes. Unfortunately,<br />
the mountains of New Guinea are usually obscured by cloud cover, <strong>and</strong><br />
only one L<strong>and</strong>sat image (see fig. 8) showing the Puncak Jaya glaciers<br />
prior to 1980 is available (1643-00253, b<strong>and</strong> 7; 27 April 1974; Path 110,<br />
Row 63) (fig. 7 <strong>and</strong> table 1).<br />
More recent images showing the glaciers have, however, become<br />
available since the Australian L<strong>and</strong>sat station started to receive data<br />
from the Irian Jaya region in 1980. The Puncak Jaya <strong>and</strong> Ngga Pilimsit<br />
glaciers are clearly seen in L<strong>and</strong>sat 4 multispectral scanner (MSS) im<br />
ages for 8 September 1982, 30 January 1983, <strong>and</strong> 19 March 1983, while<br />
the small Puncak M<strong>and</strong>ala ice cap can be identified in a L<strong>and</strong>sat 2 MSS<br />
image for 19 August 1981 <strong>and</strong> L<strong>and</strong>sat 4 MSS images for 21 March 1983<br />
<strong>and</strong> 3 January 1984 (table 1).<br />
H10 SATELLITE IMAGE ATLAS OF GLACIERS OF THE WORLD
130°E 135°E 140°E<br />
Figure 7. Index map to the optimum<br />
L<strong>and</strong>sat 1, 2, <strong>and</strong> 3 images of the glaciers<br />
of Irian Jaya.<br />
EXPLANATION OF SYMBOLS<br />
Evaluation of image usability for glaciologic, geologic,<br />
<strong>and</strong> cartographic applications. Symbols defined as follows:<br />
Excellent image (0 to
TABLE I.-Optimum L<strong>and</strong>sat 1, 2, <strong>and</strong> 3 images of the glaciers of Irian Jaya<br />
[Five optimum L<strong>and</strong>sat 4 MSS images are also included in the table to provide better coverage of the glacierized areas of Irian Jaya. These images were<br />
found by the authors, but it is possible that better, more recent imagery of the area is available. In the "Code" column, a filled-in circle means an ex<br />
cellent image (0 to 10 to< 100 percent cloud cover)]<br />
Path-Row<br />
108-63<br />
108-63<br />
110-63<br />
110-63<br />
101-63<br />
101-63<br />
103-63<br />
103-63<br />
103-63<br />
Nominal scene<br />
center<br />
(la t. -long.)<br />
004° 20'S.<br />
140° 03'E.<br />
004° 20'S.<br />
140° 03'E.<br />
004° 20'S.<br />
137° ll'E.<br />
004° 20'S.<br />
137° ll'E.<br />
004° 20'S.<br />
139° 58'E.<br />
004° 20'S.<br />
139° 58'E.<br />
004° 20'S.<br />
136° 53'E.<br />
004° 20'S.<br />
136° 53'E.<br />
004° 20'S.<br />
136° 53'E.<br />
L<strong>and</strong>sat identi<br />
fication number<br />
22113-00073<br />
22401-00035<br />
1643-00253<br />
30716-00153<br />
40248-00191<br />
40536-00182<br />
40054-00292<br />
40198-00313<br />
40246-00313<br />
Solar<br />
Date elevation angle Code<br />
(in degrees)<br />
L<strong>and</strong>sat 1-3<br />
04 Nov 80 51<br />
19 Aug 81 48<br />
27 Apr 74 50<br />
19 Feb 80 51<br />
L<strong>and</strong>sat 4<br />
21 Mar 83 55<br />
03 Jan 84 51<br />
08 Sep 82 53<br />
30 Jan 83 53<br />
19 Mar 83 54<br />
H12 SATELLITE IMAGE ATLAS OF GLACIERS OF THE WORLD<br />
3<br />
3<br />
3<br />
3<br />
3<br />
3<br />
Cloud<br />
cover Remarks<br />
(in percent)<br />
60 Covers Puncak M<strong>and</strong>ala glacier<br />
area, but cloud in immediate<br />
glacier region; color composite<br />
available; archived by Australian<br />
L<strong>and</strong>sat Station<br />
0 As above but largely cloud free<br />
around glacier; color composite<br />
available; archived by Australian<br />
L<strong>and</strong>sat Station<br />
0 Covers Puncak Jaya <strong>and</strong> Ngga<br />
Pilimsit glacier areas; color<br />
composite available<br />
90 As above; mostly high, thin<br />
cloud except along the main<br />
range; glacier partly obscured;<br />
color composite <strong>and</strong> partial<br />
scenes available; archived by<br />
Australian L<strong>and</strong>sat Station<br />
50 Covers Puncak M<strong>and</strong>ala glacier<br />
area; glacier region partly cloud<br />
free; archived by Australian<br />
L<strong>and</strong>sat Station<br />
80 As above but more cloud in<br />
glacier region; archived by<br />
Australian L<strong>and</strong>sat Station<br />
0 Covers Puncak Jaya <strong>and</strong> Ngga<br />
Pilimsit regions; glaciers cloud<br />
free; archived by Australian<br />
L<strong>and</strong>sat Station<br />
50 Covers Puncak Jaya <strong>and</strong> Ngga<br />
Pilimsit; scattered cloud in<br />
glacier region; archived by<br />
Australian L<strong>and</strong>sat Station<br />
20 As above but less cloud in<br />
glacier region (only on the<br />
southern side of main range); ar<br />
chived by Australian L<strong>and</strong>sat<br />
Station
Observation <strong>and</strong> Mapping of the Glaciers<br />
Shown on L<strong>and</strong>sat Images<br />
Puncak Jaya <strong>and</strong> Ngga Pilimsit<br />
The L<strong>and</strong>sat scene (1643-00253, b<strong>and</strong> 7; 27 April 1974; Path 110, Row<br />
63), which includes the Puncak Jaya glaciers, is shown at 1:1,000,000<br />
scale in figure 8. The major ice fields appear just above the center of the<br />
scene, with the small ice field on Ngga Pilimsit about 12 km west of<br />
these. The glaciers are discernible on all MSS b<strong>and</strong>s but are most clearly<br />
delineated on the near-infrared MSS b<strong>and</strong>s 6 <strong>and</strong> 7. On MSS b<strong>and</strong>s 4 <strong>and</strong><br />
5 it is difficult to distinguish the ice from unvegetated limestone, which<br />
also has a high reflectivity. This is particularly noticeable around Ngga<br />
Pilimsit, even on MSS b<strong>and</strong> 7 (fig. 8). The Ngga Pilimsit ice body consists<br />
of a small ice cap, several hundred meters in diameter, on the summit,<br />
plus a similar-sized glacier on a ledge below <strong>and</strong> to the southwest of the<br />
summit (fig. 9). Only the lower ice field can be distinguished from the<br />
surroundings on MSS b<strong>and</strong> 7 (fig. 8), although there is a slight variation<br />
in the gray scale between the summit ice <strong>and</strong> the surroundings on MSS<br />
b<strong>and</strong> 6 (fig. 10).<br />
A L<strong>and</strong>sat MSS false-color composite (b<strong>and</strong>s 4, 5, <strong>and</strong> 7) of this scene<br />
has been examined, but, in general, it shows less than separate examina<br />
tion of the individual b<strong>and</strong>s. The MSS b<strong>and</strong> 7 image best displays the<br />
area surrounding the ice fields. The glaciers are at an elevation of more<br />
than 4,300 m astride the crestal ridges of this part of the central range of<br />
New Guinea. To the south the elevation decreases abruptly within a<br />
distance of 40 km to the lowl<strong>and</strong> swamps, which extend to the Arafura<br />
Sea 50 km farther south. The southern face of the range is carved by<br />
gullies of the predominantly north-south drainage system. To the north<br />
the l<strong>and</strong> surface falls more gradually, <strong>and</strong> high grassy plateaus, more<br />
than 3,000 m in elevation, extend east-west immediately north of the<br />
divide.<br />
Large morainal ridges can be seen immediately north of the ice fields<br />
of the Puncak Jaya region shown in figure 8, extending up to 5 km onto<br />
the Kemabu Plateau. These remnants of the youngest Pleistocene<br />
glaciation (Wisconsinan, or Wurm) can be mapped directly from the<br />
L<strong>and</strong>sat image <strong>and</strong> show a distribution very similar to that given on the<br />
CGE l:250,000-scale map sheet cited previously. Minor differences be<br />
tween the two maps are largely due to discrepancies in the base map for<br />
the CGE sheet. Similarly, a plot from the L<strong>and</strong>sat image of the promi<br />
nent lakes on the plateau, <strong>and</strong> the river courses, shows minor discrepan<br />
cies in the l:l,000,000-scale Royal Australian Air Force (RAAF) Opera<br />
tional Navigation Chart of the region (ONC M-13, edition 4, 1973).<br />
The present-day ice-covered areas are shown in more detail in figure<br />
10. MSS b<strong>and</strong> 6 provides the clearest delineation of the ice, although we<br />
have also made extensive use of the MSS b<strong>and</strong> 7 image. Even the<br />
Southwall Hanging Glaciers, less than 100 m in the north-south dimen<br />
sion, are clearly shown on the image.<br />
GLACIERS OF <strong>IRIAN</strong> <strong>JAYA</strong>, <strong>INDONESIA</strong> H13
I El36-30 El 37-001 E137-30IIS003-30<br />
APPROXIMATE SCALE<br />
10 0 10 20 30 KILOMETERS<br />
El 36-301<br />
27RPR71 C S0^-17/EI37-02 N S0^-17/E137-10 HSS<br />
KEMABU PLATEAU<br />
E137-<br />
R SLW EL50<br />
H14 SATELLITE IMAGE ATLAS OF GLACIERS OF THE WORLD<br />
North wall firn<br />
Puncak Jaya^rea<br />
"Meren<br />
A,;rx
Figure 9. Oblique aerial photograph look<br />
ing east at the Ngga Pi I im sit ice cap in<br />
1972. In 1942 the summit ice dome <strong>and</strong> the<br />
lower glacier were joined. Photograph ac<br />
quired during the Carstensz Glaciers Ex<br />
peditions (CGE).<br />
Figure 10. An approximately 1:275,000-<br />
scale enlargement of part of a L<strong>and</strong>sat 1<br />
image (1643-00253, b<strong>and</strong> 6; 27 April 1974)<br />
showing the Puncak Jaya glaciers (right)<br />
<strong>and</strong> Ngga P Him sit (left).<br />
Ngga Pilimsit<br />
Southwall Hanging Glaciers<br />
10KU.UME<br />
Northwall firn<br />
GLACIERS OF <strong>IRIAN</strong> <strong>JAYA</strong>, <strong>INDONESIA</strong> H15<br />
Meren Glacier<br />
Carstensz Glacier
In our analysis we have used only st<strong>and</strong>ard L<strong>and</strong>sat photographic<br />
products, <strong>and</strong> not digital data or photographic images with enhanced<br />
gray scales. A map of the 1974 ice extent (fig. 11) has been produced by<br />
using both simple optical enlargement of the image <strong>and</strong> density contours<br />
produced from the image by using a scanning microdensitometer.<br />
Similar techniques were used by Krimmel <strong>and</strong> Meier (1975) for the study<br />
of South Cascade Glacier, Washington State, U.S.A.<br />
Ice <strong>and</strong> snow boundaries were first traced from a l:l,000,000-scale<br />
positive transparency optically enlarged to a scale of 1:20,000. All four<br />
MSS b<strong>and</strong>s were used to derive a resultant "composite minimum bright<br />
ness" map: that is, only those areas that appeared light on all four b<strong>and</strong>s<br />
were plotted as glacierized on the final map. As noted previously, MSS<br />
b<strong>and</strong>s 6 <strong>and</strong> 7 gave a minimum ice area. Although this technique is<br />
highly subjective, <strong>and</strong> the observer did use knowledge of the local terrain<br />
to interpret the images, it did reveal several interesting features when<br />
compared with the 1972 ice boundary shown in figure 2.<br />
1972<br />
Ice <strong>and</strong> snow boundary, CGE<br />
1974<br />
Observed front of Meren Glacier<br />
April 1974<br />
L<strong>and</strong>sat-derived boundary.<br />
December 1974<br />
Boundary of snow<br />
Boundary of snow-free ice<br />
L<strong>and</strong>sat gray scales:<br />
Main map, MSS B<strong>and</strong> 7<br />
Inset, MSS B<strong>and</strong> 6<br />
Grayscale 1-5<br />
Gray scale 6-8<br />
Gray scale 9<br />
Grayscale 10-11<br />
Grayscale 12-15<br />
L<strong>and</strong>sat pixel size<br />
Solar azimuth 62<br />
H16 SATELLITE IMAGE ATLAS OF GLACIERS OF THE WORLD<br />
Figure 11. Satellite-derived boundary of<br />
the Puncak Jaya glaciers in 1974 com<br />
pared with the 1972 CGE boundary. Inset<br />
shows the 1974 boundary of the Ngga<br />
Pilimsit ice cap, 12 km west-northwest of<br />
Puncak Jaya. (See text section "Observa<br />
tion <strong>and</strong> Mapping of the Glaciers Shown<br />
on L<strong>and</strong>sat Images" for a discussion of<br />
the method used to produce the figure.)<br />
3 KILOMETERS
Along the northern edge of the eastern section of the Northwall Firn,<br />
the ice boundary is conterminous with the tops of high cliffs, <strong>and</strong> mass-<br />
balance changes do not lead to changes in the shape of the ice margin.<br />
Here the satellite-derived ice margin is very similar in shape <strong>and</strong> position<br />
to the margin as plotted photogrammetrically from the 1942 air photo<br />
graphs. The excellent agreement at these points is an indication of the<br />
accuracy <strong>and</strong> resolution obtainable from the L<strong>and</strong>sat image. The far<br />
western end of the Northwall Firn, however, does not correlate well on<br />
the two plots, although the positions are similar. This is thought to be<br />
due to errors in the CGE map, because this ice margin was determined<br />
only from oblique aerial photographs. Similarly, there are discrepancies<br />
along the eastern ice border, also limited by precipitous cliffs, <strong>and</strong> the<br />
least accurate region of the CGE map.<br />
On both MSS b<strong>and</strong>s 6 <strong>and</strong> 7, the ablation zone appears considerably<br />
darker on the Meren Glacier than on the other ice fields. The Meren<br />
snout supports a heavy population of cryoalgae (Kol <strong>and</strong> Peterson, 1976)<br />
<strong>and</strong> is riddled with englacial lakes (Peterson, 1976). These features lower<br />
the surface reflectivity, <strong>and</strong> an apparent snowline is evident on the<br />
Meren at elevations of between 4,550 <strong>and</strong> 4,650 m. This compares with<br />
the equilibrium-line elevation determined in 1972 as 4,580 m. There is<br />
some indication of a snowline, although not as obvious, in other areas<br />
where the cryoalgae are not as concentrated.<br />
There is also some evidence of continued glacier retreat, from the<br />
satellite observations. The terminus of the Meren Glacier appears to<br />
have retreated about 200 m, <strong>and</strong> the large central part of the Northwall<br />
Firn appears to have separated further into two independent firn fields,<br />
or at least into two sections joined by a thin b<strong>and</strong> of snow-free ice. The<br />
retreat of the Meren Glacier is confirmed by a single ground observation<br />
made in December 1974, 8 months after the satellite image was ob<br />
tained, which showed a retreat of 185 m since 1972 (R. Mitton, pers.<br />
commun.) but a slightly different terminus shape than that derived from<br />
the L<strong>and</strong>sat image (fig. 8).<br />
The 1981 vertical aerial photography obtained during the combined In<br />
donesian <strong>and</strong> Australian mapping, although taken after a fresh snowfall,<br />
also suggests that the central Northwall Firn had separated into two<br />
parts after 1972, <strong>and</strong> this separation is clearly seen in a recent, but un<br />
dated, oblique aerial photograph (Dick <strong>and</strong> Fenwick, 1984).<br />
As a more objective check on the ice edge, an MSS b<strong>and</strong> 7,1:1,000,000-<br />
scale positive transparency was scanned with a microdensitometer to<br />
produce the gray-scale contours shown in figure 11. The microdensi<br />
tometer aperture was set to scan an area equivalent to 80 m by about<br />
200 m on the ground (or about 1 by 2.5 times the size of L<strong>and</strong>sat picture<br />
elements (pixels)), <strong>and</strong> scans were made every 0.2 mm on the image<br />
(200 m on the ground) along the direction of the glacial valleys. The den<br />
sity contours plotted in figure 11 have been condensed from the 15 L<strong>and</strong>-<br />
sat photographic gray-scale levels (1 = white, 15 = black).<br />
The snow-covered areas are clearly delineated by L<strong>and</strong>sat gray-scale<br />
levels of 5 <strong>and</strong> less, but the interpretation of areas showing a level of 6 to<br />
9 is more ambiguous. The image was made with a solar elevation angle<br />
of 50° <strong>and</strong> an azimuth of 62°. Steep, unvegetated limestone slopes fac<br />
ing the Sun, for example the eastern <strong>and</strong> northern walls <strong>and</strong> the north<br />
face of the Puncak Jaya massif, show a gray-scale level of 6 to 8. These<br />
slopes may also have a scattered snow cover (compare fig. 4). Elsewhere,<br />
for example on the ablation zone of the Meren Glacier <strong>and</strong> possibly in<br />
other areas near southern or western ice edges, gray-scale levels of 6 to<br />
9 indicate bare ice. The unvegetated limestone, not directly sunlit, shows<br />
a level of 9 to 11, <strong>and</strong> lakes, or heavily shaded areas, a level of 11 to 12.<br />
GLACIERS OF <strong>IRIAN</strong> <strong>JAYA</strong>, <strong>INDONESIA</strong> HIT
Because the Southwall Hanging Glaciers are less than 100 m wide, they<br />
do not show in the contours made from a scanning interval of 200 m, but<br />
they can be seen on the optically enlarged image.<br />
The December 1974 ice boundary shown in figure 11 has been plotted<br />
from a combination of the density contours <strong>and</strong> the optical enlargement<br />
<strong>and</strong> is compared with the 1972 CGE ice boundary. The inset map of the<br />
Ngga Pilimsit ice cap, the first produced for that area, has been derived<br />
from the density contours of the MSS b<strong>and</strong> 6 image. Table 2 shows the<br />
1974 ice areas compared with 1972 areas, after the latter have been cor<br />
rected for map errors revealed by the satellite data. Continued retreat of<br />
the ice fields between 1972 <strong>and</strong> 1974 is apparent.<br />
TABLE 2. Ice areas (in square kilometers) in the Puncak Jaya region<br />
[Areas in parentheses include possible snow-free ice areas on the Northwall Firn]<br />
February 1972 April 1974<br />
Northwall Firn ___________ 3.6 2.8(3.0)<br />
Meren Glacier __________ 2.2 2.1<br />
Carstensz Glacier (including<br />
Wollaston <strong>and</strong> Van de<br />
Water Glaciers) _________ 1.4 1.4<br />
Southwall Hanging Glaciers ___ .1 .1<br />
Total _____________ 7.3 6.4 (6.6)<br />
Ngga Pilimsit ice cap _______ .2<br />
Puncak M<strong>and</strong>ala<br />
Location <strong>and</strong> observation of the small M<strong>and</strong>ala ice field on L<strong>and</strong>sat im<br />
agery is not as simple as for the much larger Puncak Jaya glaciers or for<br />
the Ngga Pilimsit ice cap, which can be located relative to the Puncak<br />
Jaya glaciers. We have been able to use first-h<strong>and</strong> knowledge of the ter<br />
rain features in the Puncak Jaya area when interpreting the L<strong>and</strong>sat im<br />
ages; we do not have such knowledge of Puncak M<strong>and</strong>ala.<br />
Neither maps, such as the l:l,000,000-scale U.S. Defense Mapping<br />
Agency Operational Navigation Chart, ONC M-13, nor the latitude <strong>and</strong><br />
longitude gridding on the primary L<strong>and</strong>sat image products is accurate<br />
enough to locate Puncak M<strong>and</strong>ala by absolute geographical position. We<br />
can, however, locate the region relative to the extensive drainage net of<br />
the Sungai Pulau (Einl<strong>and</strong>en River), which shows similar features on the<br />
images <strong>and</strong> map (although separated by about 11 km in absolute position<br />
near Puncak M<strong>and</strong>ala). This drainage net, on the southern slopes of the<br />
New Guinea Cordillera, shows up most clearly in images obtained during<br />
February, March, <strong>and</strong> April, when the rivers are swollen following the<br />
southwest monsoons.<br />
Identification of the ice field is further complicated by light-colored<br />
limestone (especially where recently deglaciated), short-lived snowfalls,<br />
<strong>and</strong> even the smallest convective or orographic clouds, which are com<br />
mon <strong>and</strong> are often as large as or larger than the ice cap. The Puncak<br />
M<strong>and</strong>ala ice cap can, however, be identified on L<strong>and</strong>sat images of 19<br />
August 1981, 21 March 1983, <strong>and</strong> 3 January 1984 (although there is also<br />
new snow in the last scene) (table 1). While the imagery confirms the<br />
continued existence of this very small ice cap, we do not believe that the<br />
imagery can be used either to map or to record changes in the ice field<br />
without ground-observation data for the region.<br />
HIS SATELLITE IMAGE ATLAS OF GLACIERS OF THE WORLD
Changes in the Puncak Jaya Glaciers,<br />
1974 to 1983<br />
The recent images obtained by the Australian L<strong>and</strong>sat Station (table<br />
1) allow continued monitoring of fluctuations of the Puncak Jaya<br />
glaciers. Examination of the images for 8 September 1982 <strong>and</strong> 19 March<br />
1983 shows no significant change in extent of the ice fields since 1974,<br />
meaning that no change in ice edge of greater than 100 m has occurred.<br />
Separation of the North wall Firn into four independent firn fields is con<br />
firmed by these images, but even the smallest, western portion of the<br />
Northwall Firn <strong>and</strong> the Southwall Hanging Glaciers are largely un<br />
changed since 1974. The low albedo of the ablation zone of the Meren<br />
Glacier makes it difficult to distinguish the ice from recently deglaciated<br />
limestone in front of the glacier.<br />
Allison <strong>and</strong> Kruss (1977) used a numerical model of glacier dynamics<br />
to simulate the extensive retreat of the Meren <strong>and</strong> Carstensz Glaciers<br />
observed between 1936 <strong>and</strong> 1972. They attributed that retreat to a rise<br />
in air temperature of about 0.6°C per century since around 1850. The<br />
decrease in glacier-retreat rate between 1974 <strong>and</strong> 1983 does not, how<br />
ever, suggest a reversal or cessation of this warming: the model results<br />
predicted that, despite continued warming at the above rate, the glacier-<br />
retreat rates would decrease after about 1975.<br />
While not in immediate danger of disappearing altogether, it would<br />
appear that the Meren <strong>and</strong> Carstensz Glaciers, the only true valley<br />
glaciers in New Guinea, are becoming relatively simple firn fields or ice<br />
caps <strong>and</strong> are becoming less sensitive to climatic variations.<br />
Conclusion<br />
L<strong>and</strong>sat MSS images offer the possibility of monitoring glaciers as<br />
small as those on the Puncak Jaya massif <strong>and</strong> of identifying the even<br />
smaller ice masses of Ngga Pilimsit <strong>and</strong> Puncak M<strong>and</strong>ala.<br />
The L<strong>and</strong>sat imagery can be used to monitor glacier retreat (or ad<br />
vance), to correct errors in existing maps, <strong>and</strong> possibly to give a gross in<br />
dication of the mass balance from the snowline elevation, which, in this<br />
region, varies little seasonally. We must stress, however, that proper in<br />
terpretation of the images requires knowledge of the terrain from<br />
ground studies. Although obviously lacking the resolution of aerial<br />
photographs, the L<strong>and</strong>sat images offer greater frequency of coverage,<br />
consistency of data, <strong>and</strong>, for these equatorial regions, uniformity of il<br />
lumination (Sun angle). Provided proper <strong>and</strong> adequate ground truth is<br />
available, even more detailed information could be obtained from<br />
analysis of the L<strong>and</strong>sat digital data or by the use of the higher resolution<br />
L<strong>and</strong>sat thematic mapper data.<br />
Acknowledgments<br />
The authors acknowledge the consistently helpful <strong>and</strong> patient support<br />
of staff of the Australian L<strong>and</strong>sat Station in directing us to the most<br />
suitable imagery, <strong>and</strong> both H.M.S. Hartono, Director, Indonesian<br />
Geological Research <strong>and</strong> Development Centre, <strong>and</strong> David Trail, Bureau<br />
of Mineral Resources, Australia, Irian Jaya Geological Mapping Project,<br />
for making available the 1976 <strong>and</strong> 1980 aerial photographs.<br />
GLACIERS OF <strong>IRIAN</strong> <strong>JAYA</strong>, <strong>INDONESIA</strong> H19
References Cited<br />
Allison, I., 1975, Morphology <strong>and</strong> dynamics of the tropical glaciers<br />
of Irian Jaya: Zeitschrift fur Gletscherkunde und Glazialgeologie,<br />
v. 10 (1974), no. 1-2, p. 129-152.<br />
1976, Glacier regimes <strong>and</strong> dynamics, in Hope, G.S., Peterson,<br />
J.A., Radok, U., <strong>and</strong> Allison, I., eds., The equatorial glaciers of<br />
New Guinea: Rotterdam, A.A. Balkema, p. 39-59.<br />
Allison, I., <strong>and</strong> Bennett, J., 1976, Climate <strong>and</strong> microclimate, in<br />
Hope, G.S., Peterson, J.A., Radok, U., <strong>and</strong> Allison, I., eds., The<br />
equatorial glaciers of New Guinea: Rotterdam, A.A. Balkema, p.<br />
61-80.<br />
Allison, I., <strong>and</strong> Kruss, P., 1977, Estimation of recent climate change<br />
in Irian Jaya by numerical modeling of its tropical glaciers: Arctic<br />
<strong>and</strong> Alpine Research, v. 9, no. 1, p. 49-60.<br />
Allison, I., <strong>and</strong> Peterson, J.A., 1976, Ice areas on Mt. Jaya: Their<br />
extent <strong>and</strong> recent history, in Hope, G.S., Peterson, J.A., Radok,<br />
U., <strong>and</strong> Allison, I., eds., The equatorial glaciers of New Guinea:<br />
Rotterdam, A.A. Balkema, p. 27-38.<br />
Anderson, E.G., 1976, Topographic survey <strong>and</strong> cartography, in Hope,<br />
G.S., Peterson, J.A., Radok, U., <strong>and</strong> Allison, I., eds., The<br />
equatorial glaciers of New Guinea: Rotterdam, A.A. Balkema,<br />
p. 15-25.<br />
Dick, G., <strong>and</strong> Fenwick, J., 1984, Where the ice age lingers: Panorama,<br />
no. 31, p. 9-15 (Ansett Airlines in-flight magazine).<br />
Dozy, J.J., 1938, Eine Gletscherwelt in Niederl<strong>and</strong>isch-Neuguinea:<br />
Zeitschrift fur Gletscherkunde, v. 26, no. 1-2, p. 45-51.<br />
Garren, W.R., Peterson, B.D., <strong>and</strong> Page, C.R., 1982, Gazetteer of<br />
Indonesia (3d ed.): Washington, D.C., Defense Mapping Agency,<br />
2 v., 1529 p.<br />
Hope, G.S., <strong>and</strong> Peterson, J.A., 1976, Palaeoenvironments, in Hope,<br />
G.S., Peterson, J.A., Radok, U., <strong>and</strong> Allison, I., eds., The<br />
equatorial glaciers of New Guinea: Rotterdam, A.A. Balkema,<br />
p. 173-205.<br />
Kol, E., <strong>and</strong> Peterson, J.A., 1976, Cryobiology, in Hope, G.S.,<br />
Peterson, J.A., Radok, U., <strong>and</strong> Allison, I., eds., The equatorial<br />
glaciers of New Guinea: Rotterdam, A.A. Balkema, p. 81-91.<br />
Krimmel, R.M., <strong>and</strong> Meier, M.F., 1975, Glacier applications of ERTS<br />
images: Journal of Glaciology, v. 15, no. 73, p. 391-401.<br />
Mercer, J.H., 1967, Glaciers of New Guinea, in Southern hemisphere<br />
glacier atlas: Technical Report 67-76-ES by the American Geo<br />
graphical Society, New York, for the Earth Sciences Laboratory,<br />
U.S. Army Natick Laboratories, Natick, Massachusetts, Series<br />
ES-33, June, p. 197-207.<br />
Miiller, F., 1977, Fluctuations of glaciers, 1970-1975: Paris, Inter<br />
national Association of Hydrological Sciences, UNESCO, 269 p.<br />
Peterson, J.A., 1976, The lakes, in Hope, G.S., Peterson, J.A., Radok,<br />
U., <strong>and</strong> Allison, I., eds., The equatorial glaciers of New Guinea:<br />
Rotterdam, A.A. Balkema, p. 93-112 (includes appendices by<br />
I.A.E. Bayly, p. 107-110 <strong>and</strong> Joan Fowling, p. 111).<br />
Peterson, J.A., Hope, G.S., <strong>and</strong> Mitton, R., 1973, Recession of snow<br />
<strong>and</strong> ice fields of Irian Jaya, Republic of Indonesia: Zeitschrift fur<br />
Gletscherkunde und Glazialgeologie, v. 9, no. 1-2, p. 73-87.<br />
H20 SATELLITE IMAGE ATLAS OF GLACIERS OF THE WORLD
Glaciers of Irian Jaya, Indonesia,<br />
<strong>and</strong> New Zeal<strong>and</strong><br />
GLACIERS OF <strong>NEW</strong> <strong>ZEALAND</strong><br />
By TREVOR J.H. CHINN<br />
SATELLITE IMAGE ATLAS OF GLACIERS OF THE WORLD<br />
Edited by RICHARD S. WILLIAMS, Jr., <strong>and</strong> JANE G. FERRIGNO<br />
U. S. GEOLOGICAL SURVEY PROFESSIONAL PAPER 1386-H-2<br />
L<strong>and</strong>sat images, in conjunction with<br />
aerial photographs <strong>and</strong> field<br />
measurements, were used to monitor<br />
changes in the transient snowline <strong>and</strong><br />
the largest glaciers of New Zeal<strong>and</strong><br />
UNITED STATES GOVERNMENT PRINTING OFFICE, WASHINGTON : 1989
CONTENTS<br />
Glaciers of New Zeal<strong>and</strong> ________________________ H25<br />
Abstract _________________________________ 25<br />
Introduction _______________________________ 25<br />
FIGURE 1. Location map showing glacial regions <strong>and</strong> locations of glaciers<br />
mentioned in the text _______________________ 27<br />
Occurrence of glaciers _________________________ 26<br />
FIGURE 2. Oblique aerial photograph looking northeast on 22 March 1983 at<br />
the Garden of E den ________________________ 28<br />
3. Graph showing distribution by size of 468 Canterbury glaciers of<br />
the Mount Whitcombe region __________________ 29<br />
4. Graph showing distribution by size of 351 Westl<strong>and</strong> glaciers of the<br />
Mount Whitcombe region ____________________ 29<br />
5. Aspect rose diagrams of 819 glaciers of the Mount Whitcombe<br />
region ________________________________ 29<br />
Observation of glaciers _________________________ 30<br />
Historical glacier observations ________________ 30<br />
Modern glacier observations _________________ 31<br />
FIGURE 6. Graph showing measured variations in the position of the termini of<br />
the Fox, Franz Josef, <strong>and</strong> Ivory Glaciers ____________ 31<br />
7. Glacier elevation-difference map of Ivory Glacier from April 1971<br />
to March 1988 ___________________________ 32<br />
Mapping of glaciers ___________________________ 34<br />
Earliest maps _________________________ 34<br />
Present maps _________________________ 35<br />
Imaging of glaciers ___________________________ 36<br />
Aerial photography _ ___________________ 36<br />
Satellite imagery _______________________ 36<br />
FIGURE 8. Map of New Zeal<strong>and</strong> showing availability of L<strong>and</strong>sat images of<br />
glaciers _______________________________ 37<br />
9. Oblique aerial photograph looking east on 11 April 1978 at a small<br />
unnamed glacier under Mount Kensington ___________ 39<br />
10. Oblique aerial photograph looking east on 16 April 1980 at the Jalf<br />
Glacier _______________________________ 39<br />
TABLE 1. Optimum L<strong>and</strong>sat 1, 2, <strong>and</strong> 3 images of glaciers of New Zeal<strong>and</strong> 38<br />
Types of glaciers <strong>and</strong> phenomena observable on L<strong>and</strong>sat images _ 40<br />
Glacier advance <strong>and</strong> recession ________________ 40<br />
Glacier flow ___________________________ 46<br />
Climatic variations _ ____________________ 46<br />
FIGURE 11. L<strong>and</strong>sat 3 RBV image of part of the Mount Cook region showing<br />
glacierkarst features developing on the Tasman Glacier ____ 41<br />
12. Oblique aerial photograph looking northeast on 11 April 1978 of the<br />
debris-covered <strong>and</strong> detached trunk of Douglas Glacier ____ 42<br />
13. Diagram showing historic variation of the terminus of the Franz<br />
Josef Glacier <strong>and</strong> associated events _______________ 43<br />
14. Vertical aerial photographic mosaic of the terminus <strong>and</strong> environs of<br />
the Franz Josef Glacier in 1983 showing outlines of positions of<br />
the glacier front over the past two centuries __________ 42<br />
15. L<strong>and</strong>sat 2 MSS false-color composite showing Pleistocene glacial<br />
features <strong>and</strong> moraines around Lakes Pukaki, Tekapo, <strong>and</strong> Ohau 44<br />
16. L<strong>and</strong>sat 2 MSS image of a large Pleistocene lateral moraine ____ 45<br />
17. Oblique aerial photograph on 14 March 1980 of a recent rock<br />
avalanche that fell onto Murchison Glacier during December<br />
1979 ________________________________ 46<br />
TABLE 2. Glacier-snowline variations with time ________________ 47<br />
Conclusions 47<br />
References cited ______ _ _ 48<br />
CONTENTS H23
SATELLITE IMAGE ATLAS OF GLACIERS OF THE WORLD<br />
GLACIERS OF <strong>IRIAN</strong> <strong>JAYA</strong>, <strong>INDONESIA</strong>,<br />
AND <strong>NEW</strong> <strong>ZEALAND</strong>-<br />
GLACIERS OF <strong>NEW</strong> <strong>ZEALAND</strong><br />
By TREVOR J.H. CHINN1<br />
Abstract<br />
Glaciers occur on the North Isl<strong>and</strong> on Mount Ruapehu <strong>and</strong> on the South Isl<strong>and</strong> along the<br />
crest of the Southern Alps from the Spenser Mountains in the north to southern Fiordl<strong>and</strong><br />
in the south. New Zeal<strong>and</strong> has a humid maritime climate. The prevailing westerly winds<br />
bring 3,000 mm of annual precipitation to the western coastal plains, 15,000 mm to just west<br />
of the main divide, <strong>and</strong> 1,000 mm to the eastern ranges. Easterly <strong>and</strong> southerly winds are<br />
important sources of snow east of the main divide. A comprehensive glacier inventory<br />
that has just been completed indicates that the total number of glaciers exceeding 0.01 km2<br />
in area in the Southern Alps is about 3,155, with an estimated volume of 53.3 km3 <strong>and</strong> an<br />
area of 1,159 km2 . There are six glaciers on Mount Ruapehu. The first published<br />
descriptions of New Zeal<strong>and</strong> glaciers occurred in 1859. Early visitors made observations on<br />
positions of termini <strong>and</strong> rates of movement of the glaciers, <strong>and</strong>, in 1889, the first precise<br />
measurements were carried out. Modern studies began in the 1950's <strong>and</strong> included studies of<br />
flow, fluctuation, <strong>and</strong> mass <strong>and</strong> water balance on individual glaciers. The mapping of<br />
glaciers began with sketches of Franz Josef Glacier in 1865. The first maps were produced<br />
in the 1890's. Topographic mapping of the entire country at a scale of 1:63,360 with 100-ft<br />
contours was begun in 1958 <strong>and</strong> completed in the 1970's. Currently the Department of<br />
Survey <strong>and</strong> L<strong>and</strong> Information is preparing a new series at a scale of 1:50,000 with a 25-m<br />
contour interval. Aerial photographs of all glacierized areas are available; L<strong>and</strong>sat images<br />
cover all the areas, but not all the images are useful for glacial observations because of cloud<br />
cover or seasonally incorrect acquisition dates. L<strong>and</strong>sat images are more appropriate for<br />
studies of the larger glaciers, because the spatial resolution of the image is inadequate for<br />
glaciers smaller than about 1.0 km2 . However, L<strong>and</strong>sat imagery is useful in many cases in<br />
New Zeal<strong>and</strong> for determining the rate <strong>and</strong> direction of glacier flow, changes in glacier<br />
snowline <strong>and</strong> margins, <strong>and</strong> past glacier extent on the basis of morainal sequences.<br />
Introduction<br />
New Zeal<strong>and</strong> comprises three main isl<strong>and</strong>s situated between 34° S.<br />
<strong>and</strong> 47° S. latitude. North Isl<strong>and</strong> has extensive areas of low mountain<br />
<strong>and</strong> hill country of Mesozoic <strong>and</strong> Tertiary sediments <strong>and</strong> a number of<br />
prominent volcanic cones. The mountains barely reach above the present<br />
vegetation limit, <strong>and</strong> the scant evidence available suggests that glaciers<br />
possibly did occur on the highest of these ranges during the Pleistocene.<br />
Three of the highest of the volcanic cones reach close to the permanent<br />
snowline, but only Mount Ruapehu, whose summit is at 2,752 m, sup<br />
ports snowfields, which form six glaciers.<br />
1 New Zeal<strong>and</strong> Geological Survey, University of Canterbury, Private Bag, Christchurch, New<br />
Zeal<strong>and</strong>.<br />
GLACIERS OF <strong>NEW</strong> <strong>ZEALAND</strong> H25
South Isl<strong>and</strong> is more mountainous than North Isl<strong>and</strong>, <strong>and</strong> the boun<br />
dary between the Pacific <strong>and</strong> Indian plates cuts diagonally through the<br />
isl<strong>and</strong> from southwest to northeast as the New Zeal<strong>and</strong> Alpine fault.<br />
Toward the northeast, the single fault splinters into a number of faults.<br />
Vertical <strong>and</strong> dextral strike-slip movements continue <strong>and</strong> have rapidly<br />
uplifted the young, steep mountains east of the fault line, with lesser<br />
uplift to the west <strong>and</strong> north of the fault line. Rock types may be roughly<br />
divided into three simple categories: crystalline plutonic rocks of Fiord-<br />
l<strong>and</strong> in the southwest; schist in the central south, which wedges out<br />
northward adjacent to the fault; <strong>and</strong> s<strong>and</strong>stone to the east <strong>and</strong> north of<br />
the schist.<br />
Average peak summits range from 1,850 m in Fiordl<strong>and</strong> to 3,000 m in<br />
the central Southern Alps (Mount Cook, the highest, reaches 3,764 m)<br />
<strong>and</strong> descend to 2,000 m in the north-central Southern Alps. To the north<br />
east young blocks of the Kaikoura Ranges reach to over 2,700 m, but be<br />
cause they receive little precipitation these peaks do not support glaciers<br />
(fig. 1). Stewart Isl<strong>and</strong> presently supports no glaciers, although small<br />
glaciers were present during the Pleistocene.<br />
New Zeal<strong>and</strong> has a humid maritime climate, with the Southern Alps<br />
lying across the path of the prevailing westerly winds. This situation<br />
creates steep, eastward precipitation gradients <strong>and</strong> a strong fohn effect.<br />
Mean annual precipitation rises rapidly from 3,000 mm along the narrow<br />
western coastal plains to a maximum of 15,000 mm or more in the<br />
western part of the Southern Alps a few kilometers west of the main<br />
divide. From this maximum, precipitation diminishes approximately ex<br />
ponentially to about 1,000 mm in the eastern ranges (Griffiths <strong>and</strong><br />
McSaveney, 1983; Chinn, 1979). Although westerly winds prevail,<br />
easterly <strong>and</strong>, more especially, southerly winds are important sources of<br />
snow to the east of the main divide. Precipitation is evenly distributed<br />
throughout the year.<br />
Occurrence of Glaciers<br />
Glaciers of the Southern Alps occur either in groups or singly from<br />
southern Fiordl<strong>and</strong> in the south to the Spenser Mountains in the north<br />
(fig. 1). Several active rock glaciers occur on the inl<strong>and</strong> Kaikoura<br />
Ranges. North of the Arthur's Pass area there are only a few small<br />
glaciers <strong>and</strong> permanent snow patches.<br />
The glaciers of the Southern Alps may be divided into four glacial<br />
regions containing groups of the larger glaciers (fig. 1). To the north, the<br />
Mount Whitcombe region includes the large Ramsay <strong>and</strong> Lyell Glaciers,<br />
together with the ice plateau of the Bracken Snowfield, <strong>and</strong> extends<br />
south to include the dual snowfields of the Garden of Eden <strong>and</strong> the<br />
Garden of Allah (fig. 2). The Mount Cook region contains the largest<br />
glaciers of the Southern Alps. These include the Godley, Classen, Mur-<br />
chison, Tasman, Hooker, <strong>and</strong> Mueller Glaciers east of the main divide,<br />
<strong>and</strong> the Franz Josef <strong>and</strong> Fox Glaciers (Sara, 1968) to the west. Farther<br />
south, the Mount Aspiring region has some extensive neve-sheathed<br />
slopes surrounding Mount Aspiring <strong>and</strong> two main glaciers, the Bonar<br />
<strong>and</strong> Volta. The Olivine Ice Plateau <strong>and</strong> adjacent valley glaciers south of<br />
Mount Aspiring are included in this region. The Mount Tutoko region,<br />
the southernmost region, encompasses the north Fiordl<strong>and</strong> <strong>and</strong> central<br />
Fiordl<strong>and</strong> glaciers.<br />
H26 SATELLITE IMAGE ATLAS OF GLACIERS OF THE WORLD
166°E<br />
40 S<br />
42 S<br />
44°S<br />
46 "S<br />
48 S<br />
<strong>NEW</strong> <strong>ZEALAND</strong><br />
NORTH ISLAND<br />
STEWART ISLAND<br />
o*<br />
£<br />
STEWART ISLAND<br />
Mt<br />
Ruapehu<br />
SOUTH ISLAND<br />
SOUTH ISLAND<br />
Figure 1. Location map showing glacial<br />
regions <strong>and</strong> locations of glaciers men<br />
tioned in the text.<br />
170 E<br />
100<br />
I<br />
Dunedin<br />
1 , " "Arthur's Pass<br />
MtWhitcombe<br />
ON<br />
,v<br />
200 KILOMETERS<br />
I<br />
o Christchurch<br />
74°E<br />
NORTH<br />
ISLAND<br />
Wellington<br />
EXPLANATION<br />
^*f Glacier<br />
- - - - Main divide<br />
Glaciers <strong>and</strong> features<br />
referred to<br />
in the text<br />
1 Ivory Glacier<br />
2 Bracken Snowfield<br />
3 Garden of Allah<br />
4 Garden of Eden<br />
5 Franz Josef Glacier<br />
6 Fox Glacier<br />
7 Ramsay Glacier<br />
8 Lyell Glacier<br />
9 Godley Glacier<br />
10 Classen Glacier<br />
11 Murchison Glacier<br />
12 Tasman Glacier<br />
13 Hooker Glacier<br />
14 Mueller Glacier<br />
15 Volta Glacier<br />
16 Bonar Glacier<br />
17 Dart Glacier<br />
18 Olivine Ice Plateau<br />
GLACIERS OF <strong>NEW</strong> <strong>ZEALAND</strong> H27
Anderton (1973) had previously identified 527 glaciers more than 0.1<br />
km2 in area <strong>and</strong> estimated the volume of water stored as perennial snow<br />
<strong>and</strong> ice in the glaciers of the Southern Alps to be approximately 50 km3 ,<br />
with an area of 810 km2. Results from the present glacier inventory<br />
indicate that the total number of glaciers exceeding 0.01 km2 in area in<br />
the Southern Alps is 3,155, with an estimated ice volume of 53.3 km3 <strong>and</strong><br />
a total glacier area of 1,159 km2 . In the Mount Whitcombe region 819<br />
glaciers have been inventoried; 351 of these occur to the west of the main<br />
divide (Westl<strong>and</strong> area) <strong>and</strong> the remaining 468 to the east of the main<br />
divide (Canterbury area). Many glaciers have areas close to 0.2 km2 , <strong>and</strong><br />
82 percent of the Canterbury glaciers are this size or smaller (fig. 3),<br />
while in Westl<strong>and</strong> 70 percent of the glaciers are equal to or less than 0.2<br />
km2 (fig. 4). Fifty percent of Canterbury glaciers are smaller than 0.06<br />
km2 , while 50 percent of Westl<strong>and</strong> glaciers are smaller than 0.09 km2 .<br />
Canterbury glaciers predominantly face south to southeast, <strong>and</strong> most<br />
Westl<strong>and</strong> glaciers face between west <strong>and</strong> north (fig. 5).<br />
H28 SATELLITE IMAGE ATLAS OF GLACIERS OF THE WORLD<br />
Figure 2. Oblique aerial photograph<br />
looking northeast on 22 March 1983 at the<br />
Garden of Eden, an ice field that has<br />
numerous outlet glaciers. A second ice<br />
field, the Garden of Allah, is visible behind<br />
the ridge separating the two neves.<br />
Photograph by Trevor J.H. Chinn, New Zea<br />
l<strong>and</strong> Geological Survey, slide A 42-29.
0.02 0.04 0.06 0.1 0.2 0.4 0.6 1<br />
GLACIER AREA (Km 2 )<br />
0.02 0.04 0.06 0.1 0.2 0.4 0.6 1<br />
GLACIER AREA (Km 2 )<br />
Figure 5. Aspect rose diagrams of 819<br />
glaciers of the Mount Whitcombe region.<br />
A, Canterbury glaciers (east of main<br />
divide); B, Westl<strong>and</strong> glaciers (west of main<br />
divide).<br />
w<br />
4 6 8 10<br />
4 6 8 10<br />
20%<br />
Figure 3. Distribution by size of 468<br />
Canterbury glaciers of the Mount Whit-<br />
combe region. Fifty percent of all glaciers<br />
of this region are less than 0.06 km 2 in<br />
area, <strong>and</strong> 82 percent are less than 0.2 km2 .<br />
Figure 4. Distribution by size of 351<br />
Westl<strong>and</strong> glaciers of the Mount Whit-<br />
combe region. Fifty percent of all glaciers<br />
of this region are less than 0.09 km 2 in<br />
area, <strong>and</strong> 70 percent are less than 0.2 km 2 .<br />
E W<br />
GLACIERS OF <strong>NEW</strong> <strong>ZEALAND</strong> H29<br />
S<br />
B
Observation of Glaciers<br />
Historical Glacier Observations<br />
The first Europeans who might have seen the glaciers of the Southern<br />
Alps were the explorers Abel Tasman (in 1642) <strong>and</strong> Captain James Cook<br />
(in 1769), when they sailed along the West Coast of New Zeal<strong>and</strong>,<br />
although neither of them mentioned seeing glaciers. The first published<br />
description of a New Zeal<strong>and</strong> glacier appears to be of the Franz Josef<br />
Glacier, recorded in the log of the Mary Louisa when sailing off the<br />
West Coast in 1859, <strong>and</strong> subsequently published in the Lyttelton (New<br />
Zeal<strong>and</strong>) Times, 6 July 1859 (Sara, 1970).<br />
Descriptions of glaciers become abundant in the 1860's, soon after the<br />
discovery of gold stimulated extensive exploration <strong>and</strong> prospecting in<br />
alpine regions, especially on the West Coast. The earliest systematic<br />
records of glaciers appear in the journals <strong>and</strong> reports of C.E. "Mr. Ex<br />
plorer" Douglas <strong>and</strong> A.P. Harper. From the late 1860's onward Douglas<br />
explored <strong>and</strong> carefully reported on most of the notoriously impenetrable<br />
West Coast valleys (Pascoe, 1957). Later, mainly in the 1890's, A.P.<br />
Harper carried out a tremendous amount of exploration work for the<br />
Department of L<strong>and</strong>s <strong>and</strong> Survey, frequently in the company of Douglas<br />
(Harper, 1896 <strong>and</strong> 1946). Harper was also a mountaineer <strong>and</strong> explored<br />
many of the glaciers on the eastern side of the ranges. Further<br />
systematic records of the glaciers appear in the New Zeal<strong>and</strong> Alpine<br />
Journal, first published in 1892.<br />
Early volumes of the New Zeal<strong>and</strong> Alpine Journal contain accounts of<br />
the visits of Julius von Haast to the headwaters <strong>and</strong> glaciers of Rakaia<br />
<strong>and</strong> Rangitata Rivers in 1861, <strong>and</strong> to Tasman, Hooker, <strong>and</strong> Mueller<br />
Glaciers in 1862. In 1865, von Haast made the first sketch of Franz Josef<br />
Glacier, <strong>and</strong> its terminus was first photographed in 1867 by T. Pringle<br />
(Sara, 1970). Throughout the 1860's to the 1880's the headwaters of the<br />
main rivers on the eastern side of the Alps were visited by explorers,<br />
while Douglas systematically explored each of the rugged forested<br />
valleys of the west to its headwaters glaciers. By 1900, guided tours<br />
were being conducted from both sides of the Alps on Franz Josef <strong>and</strong><br />
Tasman Glaciers.<br />
Many of these early visitors made observations on the positions of the<br />
glacier termini <strong>and</strong> on rates of ice movement (Mannering, 1891; Fitz-<br />
Gerald, 1896). In 1889, T.N. Brodrick began mapping topography <strong>and</strong><br />
glaciers in the Mount Cook area (Gellatly, 1985). Cross-glacier lines of<br />
stakes were installed on Tasman, Murchison, <strong>and</strong> Hooker Glaciers, while<br />
painted stones were positioned in a line across Mueller Glacier. This<br />
work was the first precise glaciological measurement carried out in New<br />
Zeal<strong>and</strong>. These sections were resurveyed in 1962 (Skinner, 1964). Obser<br />
vations of the positions of the termini of Franz Josef <strong>and</strong> Fox Glaciers by<br />
surveys <strong>and</strong> photographic records have been sporadically maintained<br />
since 1894 (fig. 6), <strong>and</strong> occasional measurements of rates of movement<br />
have been made (Bell, 1910; Speight, 1939). During the past two<br />
decades, National Park staff have taken weekly photographs from fixed<br />
points, giving a permanent time-lapse record of all fluctuations of glacier<br />
termini.<br />
H30 SATELLITE IMAGE ATLAS OF GLACIERS OF THE WORLD
Figure 6. Measured variations in the<br />
position of the termini of the Fox, Franz w<br />
Josef, <strong>and</strong> Ivory Glaciers. £<br />
2.8<br />
2.4<br />
3 2.2<br />
I 2.0<br />
H 1-8<br />
6 1-6<br />
D.<br />
> 1.4<br />
1.0<br />
0.8<br />
0.6<br />
0.4<br />
0.2<br />
0<br />
-0.2<br />
-0.4<br />
1870<br />
~2 \ \ \ \ r<br />
-- _^_^-\<br />
Franz Josef Glacier<br />
Ivory Glacier-^<br />
Glacier<br />
\\ x<br />
1880 1890 1900 1910 1920 1930 1940 1950 1960 1970 1980 1988<br />
Modern Glacier Observations<br />
YEAR<br />
In 1957, I.C. McKellar of the New Zeal<strong>and</strong> Geological Survey began<br />
measuring movement <strong>and</strong> ice stratigraphy on Tasman Glacier<br />
(Goldthwait <strong>and</strong> McKellar, 1962). In 1965, when this initial project was<br />
completed, the Ministry of Works initiated mass-balance measurements;<br />
this work continued until 1973 (Chinn, 1969). In 1972, ice thickness was<br />
measured over three sections across the trunk of the glacier (Anderton,<br />
1975). Repetitive oblique photographs are being made from time to time<br />
by the Mount Cook National Park Board. A recent study has<br />
documented the retreat of the small, steep Stocking Glacier, situated be<br />
tween Mueller <strong>and</strong> Hooker Glaciers (Salinger <strong>and</strong> others, 1983). To the<br />
west, the fluctuations of Franz Josef <strong>and</strong> Fox Glaciers have been docu<br />
mented by Suggate (1950), Bowen (1960), Sara (1968, 1970), <strong>and</strong> Soons<br />
(1971), but flow measurements by Gunn (1964) <strong>and</strong> McSaveney <strong>and</strong> Gage<br />
(1968) are the most comprehensive of the studies made on the ice of<br />
these glaciers.<br />
In 1968, T.J. Chinn of the Ministry of Works began mass- <strong>and</strong> water-<br />
balance studies on Ivory Glacier (fig. 7), a small glacier west of the main<br />
divide chosen as part of an International Hydrological Decade (I.H.D.)<br />
program of representative basin studies (Anderton <strong>and</strong> Chinn, 1978).<br />
These studies continued, along with energy-balance projects, until 1974.<br />
In 1975, G. Bishop of the New Zeal<strong>and</strong> Geological Survey, Dunedin, com<br />
menced limited balance <strong>and</strong> movement studies on Dart Glacier in Otago;<br />
these studies continue. On North Isl<strong>and</strong>, retreat of the glaciers of Mount<br />
Ruapehu was described by Odell (1955) <strong>and</strong> Krenek (1959). Later, in<br />
1960, permanent photographic stations were installed (Heine, 1962), <strong>and</strong><br />
balance studies were made on Whakapapanui Glacier over 1968-69<br />
(Thompson <strong>and</strong> Kells, 1973).<br />
GLACIERS OF <strong>NEW</strong> <strong>ZEALAND</strong> H31
05<br />
CD E<br />
£ 8<br />
CD CD<br />
c e 5<br />
\<br />
en<br />
\<br />
\<br />
\<br />
o<br />
c<br />
en<br />
\<br />
\<br />
H32 SATELLITE IMAGE ATLAS OF GLACIERS OF THE WORLD<br />
n
®<br />
\<br />
100 200 300 METERS<br />
\ \\<br />
\<br />
I<br />
\<br />
\ \<br />
\!<br />
Area of avalanche-fed<br />
snow <strong>and</strong> ice<br />
Snow<br />
EXPLANATION<br />
Glacier boundary, April 1971<br />
Glacier boundary, May 1975<br />
Glacier terminus position, March 1 988<br />
Catchment boundary<br />
Lake bathymetry, in meters<br />
Benchmark<br />
Photo st<strong>and</strong><br />
20-<br />
o<br />
Ice <strong>and</strong> Snow Loss<br />
0-10 meters HlLj 20-25 meters<br />
1 0-1 5 meters IB| 25-30 meters<br />
1 5-20 meters ^^^^1 More than 30 meters<br />
N
Glacier-snowline elevations (the elevation of the end-of-summer snow-<br />
line on a glacier) are being measured in a program of annual photo<br />
graphic surveys of glaciers throughout the Southern Alps. The first com<br />
plete survey was made in 1978 (Chinn <strong>and</strong> Whitehouse, 1980). Mean<br />
snowline altitudes varied from 1,500 m in the south <strong>and</strong> west to 2,200 m<br />
in the east. The trend of the snowline surface shows strongly the in<br />
fluence of westerly precipitation on the distribution of glaciers. Snow-<br />
lines descend perceptibly from the extreme west to a trough located<br />
parallel to, but somewhat east of, the zone of maximum precipitation<br />
(Griffiths <strong>and</strong> McSaveney, 1983; Chinn, 1979). With decreasing precipi<br />
tation, the snowline rises rapidly near the crest of the main divide <strong>and</strong><br />
continues to rise with a lower eastward gradient. Imposed on this<br />
generalized pattern are complex topographic variations of two origins.<br />
Large mountain masses, lying across the direction of the prevailing<br />
northwest winds <strong>and</strong> west of the divide, generate precipitation-shadow<br />
areas, the result being higher snowlines in the shadow area. This pattern<br />
of precipitation-shadow areas is repeated east of the main divide. Where<br />
low passes occur, the precipitation-shadow effect is drastically reduced;<br />
moist maritime air masses, therefore, can penetrate east of the main<br />
divide, resulting in markedly lower snowlines than in the shadow areas.<br />
Gradients of the snowline elevation across the main divide vary from<br />
25 m km -1 to 40 m km" 1. These gradients are up to four times as steep<br />
as those found at the glaciation limit2 (Porter, 1975) <strong>and</strong> 10 to 20 times<br />
as steep as those measured for arctic <strong>and</strong> subarctic regions (Andrews<br />
<strong>and</strong> Miller, 1972). Localized areas of very steep gradients occur that far<br />
exceed the mean values. The mean northeast to southwest gradient<br />
along the main divide is 1 m km" 1 , or 115 m per degree of latitude.<br />
Present glacial studies include the Dart Glacier work by the New<br />
Zeal<strong>and</strong> Geological Survey, <strong>and</strong> photographic surveys being conducted<br />
by the staff of the Westl<strong>and</strong> <strong>and</strong> Mount Cook National Parks. In addi<br />
tion, the Water <strong>and</strong> Soil Division of the Ministry of Works <strong>and</strong> Develop<br />
ment has a New Zeal<strong>and</strong> Glacier Inventory program in progress under<br />
the United Nations Educational, Scientific, <strong>and</strong> Cultural Organization<br />
(UNESCO) World Glacier Inventory project.<br />
Mapping of Glaciers<br />
Earliest Maps<br />
Mapping of the main glaciers commenced early in the period of ex<br />
ploration. These maps are the result of the efforts of a few enterprising<br />
<strong>and</strong> capable individuals. The Franz Josef Glacier was sketched by von<br />
Haast in 1865, <strong>and</strong>, in 1893, Douglas <strong>and</strong> Harper compiled the first map.<br />
Fox Glacier was surveyed by Douglas <strong>and</strong> Wilson in 1894-95. The next<br />
maps were made by Greville <strong>and</strong> Bell in 1910 (Bell, 1910).<br />
On the eastern side of the divide, almost all of the mapping work was<br />
concentrated in the Mount Cook area, where Julius von Haast made<br />
sketch plans of the Tasman, Godley, <strong>and</strong> Classen Glacier termini in the<br />
years 1862 <strong>and</strong> 1889 (Gellatly, 1985). In 1888, T.N. Brodrick began tri-<br />
angulation surveys <strong>and</strong> topographic mapping <strong>and</strong> produced a number of<br />
2 The lowest elevation in a given locality at which glaciers can develop <strong>and</strong> be sustained.<br />
H34 SATELLITE IMAGE ATLAS OF GLACIERS OF THE WORLD
maps <strong>and</strong> plans of the Mount Cook <strong>and</strong> Godley Valley glaciers from 1889<br />
until after the completion of his fieldwork in 1906.<br />
In 1893, a topographic map of the "central portion of the Southern<br />
Alps" was published by the Royal Geographical Society, London. This<br />
map, showing the four large eastern glaciers <strong>and</strong> the two large western<br />
glaciers, was probably the first to show the relative positions of glaciers<br />
on both sides of the Alps. For the remainder of the Southern Alps, from<br />
the late 1890's, a series of survey district maps was produced to which<br />
details were added as exploration (mainly for pasture l<strong>and</strong>) proceeded.<br />
In Westl<strong>and</strong>, before the turn of the century, there were practically no<br />
maps of the mountain areas apart from the sketches <strong>and</strong> maps of<br />
Douglas <strong>and</strong> Harper. The first reasonably reliable regional maps were<br />
base maps constructed in the early 1900's by the New Zeal<strong>and</strong> Geological<br />
Survey as part of their geological surveys. These maps are rich in detail<br />
<strong>and</strong> show all glaciers observed, although the accuracy varied with the<br />
surveyor's proximity to the features mapped.<br />
In 1911, a detailed map of the Franz Josef <strong>and</strong> Fox Glaciers was<br />
published by the Canterbury Progress League. This map, together with<br />
the 1893 map, was reprinted (unaltered) in 1976 in the New Zeal<strong>and</strong><br />
Alpine Journal with facsimile editions of early journal volumes.<br />
Present Maps<br />
No topographic maps of the glaciers were available until the Depart<br />
ment of L<strong>and</strong>s <strong>and</strong> Survey commenced publishing a 1-inch-to-l-mile<br />
topographic maps series (New Zeal<strong>and</strong> Mapping Series 1 at a scale of<br />
1:63,360). Publication of the first sheets began in about 1958. Until this<br />
time, uncontoured 4-mile maps of the New Zeal<strong>and</strong> Territorial Series<br />
(NZMS 10) at a scale of 1:253,440 <strong>and</strong> Survey District <strong>and</strong> County Series<br />
Cadastral Maps at 1:63,360 were the best available. By the mid 1970's,<br />
effectively the whole of New Zeal<strong>and</strong> had been mapped in the<br />
l:63,360-scale topographic series with a 100-ft contour interval. How<br />
ever, the glaciers depicted on some of these maps may not have accurate<br />
outlines in their upper areas. The maps were prepared from vertical<br />
aerial photographs on which the position of the neve boundary depends<br />
on the amount of snow, which in turn is dependent on the time of year<br />
that the photography was acquired. Most of the aerial photographic<br />
survey flight runs were not made at the correct time of year (optimum<br />
time is prior to the end-of-summer seasonal snow-cover minimum). As a<br />
result, these maps show variable amounts of snow cover. Thus, the<br />
earlier in the summer the photography, the greater the error in plotted<br />
glacier size. Attempts have been made to reduce this error, for example,<br />
on the Mount Cook Sheet (S. 79), where permanent snow boundaries<br />
have been based on data from local observations, rather than those<br />
shown on the aerial photographs. Currently, the Department of Survey<br />
<strong>and</strong> L<strong>and</strong> Information is preparing a series of maps at 1:50,000 scale <strong>and</strong><br />
with a 25-m contour interval. This remapping program is a large under<br />
taking, <strong>and</strong> it will be more than a decade before the new series is com<br />
pleted for the whole country. Data from the New Zeal<strong>and</strong> glacier inven<br />
tory are being used extensively in remapping the glacierized areas.<br />
GLACIERS OF <strong>NEW</strong> <strong>ZEALAND</strong> H35
Imaging of Glaciers<br />
Aerial Photography<br />
The first known sequences of vertical aerial photographs in New<br />
Zeal<strong>and</strong> were taken around 1937 <strong>and</strong> 1938 by New Zeal<strong>and</strong> Aerial Map<br />
ping, Ltd., but these were mainly of lowl<strong>and</strong> areas. A set of vertical<br />
aerial photographs was taken over the Franz Josef, Fox, Tasman, <strong>and</strong><br />
Hooker Glaciers in 1953, followed by a most useful set of oblique aerial<br />
photographs taken by the Royal New Zeal<strong>and</strong> Air Force along both sides<br />
of the Southern Alps in autumn 1955. These surveys were made just<br />
prior to the first of the systematic vertical aerial photographic flights<br />
made over the Southern Alps as part of a nationwide aerial photo-<br />
grammetric mapping program. By the end of the 1960's all of the<br />
glacierized areas were photographed, <strong>and</strong> many areas have been re-<br />
photographed since.<br />
Satellite Imagery<br />
All of New Zeal<strong>and</strong>'s glacierized areas are included in existing L<strong>and</strong>sat<br />
images, but not all of the images are usable for glacial observations<br />
(fig. 8). The two requisites for an optimum usable image are no cloud<br />
cover <strong>and</strong> an image acquired at the time of minimum snow cover (late<br />
summer). Many of the better images of the glacierized areas have glacial<br />
features obscured by seasonal snow. The coding for each of the nominal<br />
scene centers shown on figure 8 refers primarily to the amount of cloud<br />
cover over the glacierized regions. Table 1 provides additional informa<br />
tion on each image, including remarks about amount of snow cover.<br />
Table 1 lists the known usable images of the New Zeal<strong>and</strong> glaciers.<br />
Many additional images exist, but these are generally unacceptable be<br />
cause of excessive cloud cover or because of snow cover on winter<br />
scenes. Unfortunately, the L<strong>and</strong>sat satellite paths <strong>and</strong> image rows do<br />
not coincide well with the configuration of the glacierized areas. This<br />
results in images of the more important glacerized regions appearing at<br />
the margins of the images. The best available image of the Mount Cook<br />
area is the larger scale (1:500,000) L<strong>and</strong>sat 3RBV image (30324-21342,<br />
subscene A), corresponding to the northwest quadrant of Path 79, Row<br />
91, but this image lacks relief detail in the snowfields (Ferrigno <strong>and</strong><br />
Williams, 1983).<br />
L<strong>and</strong>sat images are more appropriate for the larger glaciers, because<br />
the spatial resolution of the image is inadequate for identifying details of<br />
small glaciers less than about 1 or 2 km2 in area. On a l:l,000,000-scale<br />
L<strong>and</strong>sat MSS image 1 km equals 1 mm, so a 1-km2 glacier would<br />
measure 1 mm2 on the image. Even on a 1:500,000-scale L<strong>and</strong>sat 3 RBV<br />
image, a 1-km2 glacier would only be 4 mm2 . Unfortunately the rapid<br />
changes in small, steep, <strong>and</strong> very active glaciers, such as the one shown<br />
in figure 9, are difficult to monitor by satellite imagery. On some small<br />
glaciers the snowline has recently risen beyond the upper limits of the<br />
glacier, thereby leaving the entire glacier in the ablation zone (fig. 10).<br />
H36 SATELLITE IMAGE ATLAS OF GLACIERS OF THE WORLD
Figure 8. Map of New Zeal<strong>and</strong> showing<br />
availability of L<strong>and</strong>sat images of glaciers.<br />
35°S<br />
40°S<br />
45°S<br />
170°E 175°E<br />
0 100 200 300 / 400 KILOMETERS<br />
I I I '<br />
EXPLANATION OF SYMBOLS<br />
Evaluation of image usability for glaciologic, geologic,<br />
<strong>and</strong> cartographic applications. Symbols defined as follows:<br />
3<br />
(3<br />
A B<br />
C W D<br />
O<br />
Excellent image (0 to 5 to 10 to < 100 percent cloud cover)<br />
Unusable image (100 percent cloud cover)<br />
Usable L<strong>and</strong>sat 3 return beam vidicon (RBV) scenes<br />
A, B, C, D refer to usable RBV subscenes<br />
Nominal scene center for a L<strong>and</strong>sat image outside<br />
the area of glaciers<br />
Approximate size of area encompassed by nominal<br />
L<strong>and</strong>sat MSS image. L<strong>and</strong>sat 3 RBV subscenes en<br />
compass slightly more than one overlapping quad<br />
rant (A, NW; B, NE; C, SW; D, SE) of an MSS nomi<br />
nal scene.<br />
GLACIERS OF <strong>NEW</strong> <strong>ZEALAND</strong> H37
TABLE 1. Optimum L<strong>and</strong>sat 1, 2, <strong>and</strong> 8 images of the glaciers of New Zeal<strong>and</strong><br />
[See figure 8 for explanation of the symbols in the "Code" column]<br />
Path-Row<br />
77-87<br />
78-90<br />
78-90<br />
78-90<br />
79-90<br />
79-90<br />
79-90<br />
79-91<br />
79-91<br />
79-91<br />
79-91<br />
79-91<br />
80-90<br />
80-91<br />
80-91<br />
81-91<br />
81-91<br />
Nominal scene<br />
center<br />
flat-long.)<br />
038° 49'S.<br />
175° 21'E.<br />
043° 05'S.<br />
172° 24'E.<br />
043° 05'S.<br />
172° 24'E.<br />
043° 05'S.<br />
172° 24'E.<br />
043° 05'S.<br />
170° 58'E.<br />
043° 05'S.<br />
170° 58'E.<br />
043° 05'S.<br />
170° 58'E.<br />
044° 30'S.<br />
170° 25'E.<br />
044° 30'S.<br />
170° 25'E.<br />
044° 30'S.<br />
170° 25'E.<br />
044° 30'S.<br />
170° 25'E.<br />
044° 30'S.<br />
170° 25'E.<br />
043° 05'S.<br />
169° 32'E.<br />
044° 30'S.<br />
168° 59'E.<br />
044° 30'S.<br />
168° 59'E.<br />
044° 30'S.<br />
168° OO'E.<br />
044° 30'S.<br />
168° OO'E.<br />
L<strong>and</strong>sat identi<br />
fication number<br />
2389-21172<br />
2192-21265<br />
30377-21275-A<br />
30377-21275-C<br />
1503-21421<br />
2391-21300<br />
2409-21293<br />
2787-21172<br />
2805-21163<br />
21111-21041<br />
30324-21342-A<br />
30324-21342-C<br />
2824-21211<br />
30739-21342<br />
1505-21540<br />
30776-21383<br />
Date<br />
15 Feb 76<br />
02 Aug 75<br />
17 Mar 79<br />
17 Mar 79<br />
08 Dec 73<br />
17 Feb 76<br />
06 Mar 76<br />
19 Mar 77<br />
06 Apr 77<br />
06 Feb 78<br />
23 Jan 79<br />
23 Jan 79<br />
25 Apr 77<br />
13 Mar 80<br />
10 Dec 73<br />
19 Apr 80<br />
Solar<br />
elevation angle<br />
(in degrees)<br />
H38 SATELLITE IMAGE ATLAS OF GLACIERS OF THE WORLD<br />
39<br />
15<br />
30<br />
30<br />
50<br />
36<br />
32<br />
26<br />
21<br />
34<br />
42<br />
42<br />
16<br />
29<br />
49<br />
19<br />
Code<br />
3<br />
3<br />
3<br />
3<br />
3<br />
3<br />
«<br />
3<br />
3<br />
3<br />
3<br />
Cloud<br />
cover<br />
(in percent)<br />
0<br />
20<br />
20<br />
20<br />
70<br />
50<br />
20<br />
10<br />
0<br />
0<br />
20<br />
0<br />
30<br />
50<br />
30<br />
0<br />
Remarks<br />
Marginal; fresh snow cover;<br />
North Isl<strong>and</strong><br />
Snow cover in mountains; color<br />
composite available<br />
L<strong>and</strong>sat 3 RBV image<br />
L<strong>and</strong>sat 3 RBV image<br />
Good; some clouds<br />
Excellent; timed at minimum<br />
snow cover; some clouds<br />
Good; some clouds<br />
Excellent; very good detail;<br />
color composite available<br />
Good detail in both neve <strong>and</strong><br />
glacier trunk area<br />
L<strong>and</strong>sat 3 RBV; best image for<br />
glacier trunk definition; lacks<br />
detail in snow<br />
L<strong>and</strong>sat 3 RBV; best image for<br />
glacier trunk definition; lacks<br />
detail in snow<br />
Marginal; some clouds; defini<br />
tion lost due to low Sun angle<br />
contrast<br />
Marginal; some clouds; some<br />
data lines missing<br />
Excellent; some cloud <strong>and</strong><br />
seasonal snow cover<br />
Excellent over glacier area; data<br />
lines missing on west
Figure 9. Oblique aerial photograph look<br />
ing east on 11 April 1978 at a small un<br />
named glacier under Mount Kensington<br />
(2,446 m) west of the main divide in the<br />
Mount Whitcombe region. The glacier,<br />
typical of steep Westl<strong>and</strong> glaciers having a<br />
high activity index, reacts strongly to<br />
climatic changes. Photograph by Trevor J.H.<br />
Chinn, New Zeal<strong>and</strong> Geological Survey,<br />
film negative no. 7826.<br />
Figure 10. Oblique aerial photograph<br />
looking east on 16 April 1980 at the Jalf<br />
Glacier, a "dying" glacier on the West<br />
Coast between Franz Josef <strong>and</strong> Fox<br />
Glaciers. The surface of bare ice indicates<br />
that the snowline has risen completely<br />
above the glacier, <strong>and</strong> no snow at all from<br />
recent winters has remained to contribute<br />
to the glacier balance. Photograph by<br />
Trevor J.H. Chinn, New Zeal<strong>and</strong> Geological<br />
Survey, film negative no. 8094.<br />
GLACIERS OF <strong>NEW</strong> <strong>ZEALAND</strong> H39
Types of Glaciers <strong>and</strong> Phenomena Observable<br />
on L<strong>and</strong>sat Images<br />
Glacier Advance <strong>and</strong> Recession<br />
All of New Zeal<strong>and</strong>'s glaciers have generally been receding since the<br />
beginning of the century (fig. 6), with fluctuating, but rising, end-of-<br />
summer snowline elevations. During the "Late Neoglacial" cool period,<br />
which persisted during the past 500 to 800 years, most New Zeal<strong>and</strong><br />
glaciers reached three main maximums, climaxing in 1750, 1850, <strong>and</strong><br />
1890 (Wardle, 1973; Burrows, 1975; Burrows <strong>and</strong> Maunder, 1975; Bur<br />
rows <strong>and</strong> Russell, 1975; Salinger, 1976; Hessell, 1980, 1983; Salinger<br />
<strong>and</strong> others, 1983). From 1890 there was a general slow recession of most<br />
glaciers until the late 1920's, when a widespread rapid retreat com<br />
menced. This retreat is continuing, punctuated by only minor read-<br />
vances in the more active glaciers (fig. 6). Associated with the retreat of<br />
glacier termini, most glaciers have suffered a reduction in size <strong>and</strong> a rise<br />
of snowline elevations. From 1971 to 1975, Ivory Glacier lost more than<br />
30 m of thickness in the terminus area, less over other parts of the<br />
glacier (fig. 7). The total volume of ice <strong>and</strong> snow lost during this period<br />
for this glacier alone was 13.9 x 10⁶ m3 , or an average annual loss of<br />
3.5 x 10⁶ m3 . During the same period the area of this glacier was re<br />
duced by 26 percent, from 0.80 km2 to 0.59 km2 . Where the larger<br />
glaciers extend to low-gradient or ponded ice trunks at valley floor level,<br />
recession is evident by a steady lowering of ice-surface levels, accom<br />
panied by little or no change in terminus position, or by the development<br />
of a proglacial lake. These glaciers have glacier snouts that are normally<br />
debris covered, <strong>and</strong> many have recently developed glacierkarst features.<br />
The glacierkarst terrain on Tasman Glacier is well displayed on L<strong>and</strong>sat<br />
3 RBV image 30324-21342, subscene A (fig. 11). Recently formed pro-<br />
glacial lakes of Classen <strong>and</strong> Godley Glaciers also appear clearly near the<br />
northern margin of this image. Figure 12 is an oblique aerial photograph<br />
of Douglas Glacier's proglacial lake, which has developed during the past<br />
20 years. The change in size of proglacial lakes is possibly the single best<br />
indicator of glacier variations seen on satellite imagery.<br />
In contrast to the slow response of glaciers with large low-gradient<br />
trunks, large glaciers with steep trunks have been very reactive to small<br />
mass-balance changes, <strong>and</strong> the long period of glacier recession during<br />
the 20th century has been manifested in a series of small advances<br />
superimposed upon a general recession, similar to waves on the seashore<br />
at ebbing tide. Franz Josef <strong>and</strong> Fox Glaciers are of this type (figs. 13 <strong>and</strong><br />
14), but unfortunately no usable L<strong>and</strong>sat images of these glaciers exist.<br />
Both glaciers lie in the corners of the available L<strong>and</strong>sat images <strong>and</strong> are<br />
either poorly displayed or obscured by cloud cover.<br />
H40 SATELLITE IMAGE ATLAS OF GLACIERS OF THE WORLD
Figure 11.-L<strong>and</strong>sat 3 RBV image (30324-<br />
21342, subscene A; 23 January 1979; Path<br />
79, Row 91) of part of the Mount Cook<br />
region showing glacierkarst features<br />
developing on the Tasman Glacier <strong>and</strong> a<br />
wide array of additional glacial features.<br />
&T PjPP. »<br />
^fet** Hi»/f-^r ^*^+ *-~ ^ H<br />
^-* * mi^i:. >m dn^Kf v v../ -* «.-^,-jfj '.« .,-»i' - ^<br />
GLACIERS OF <strong>NEW</strong> <strong>ZEALAND</strong> H41
H42 SATELLITE IMAGE ATLAS OF GLACIERS OF THE WORLD<br />
Figure 12.-Oblique aerial photograph<br />
looking northeast on 11 April 1978 of the<br />
debris-covered <strong>and</strong> detached trunk of<br />
Douglas Glacier, which terminates in a<br />
rapidly exp<strong>and</strong>ing proglacial lake. Photo<br />
graph by Trevor J.H. Chinn, New Zeal<strong>and</strong><br />
Geological Survey, film negative no. 7830.<br />
Figure 13. Historic variations of the ter-<br />
minus position of the Franz Josef Glacier<br />
<strong>and</strong> associated events. 1907 A viewing<br />
gallery giving access across a sheer rock<br />
face above the northeast margin on the<br />
snout was scraped off the rock face by this<br />
small advance shortly after being built.<br />
1930-1949 A proglacial lake formed but<br />
soon filled with outwash gravels. The lake<br />
was popular for boating until a large ice<br />
block, held submerged by debris, released<br />
its load <strong>and</strong> erupted through the lake sur<br />
face. 1965 During a heavy rainstorm in<br />
December, the main subglacial channel<br />
was apparently blocked beneath the<br />
glacier snout, <strong>and</strong> the accumulated water<br />
burst upward through the glacier to con<br />
tinue downvalley as a spectacular flood<br />
wave of water <strong>and</strong> ice. There was some<br />
damage but no casualties. 1984 A shelter<br />
hut, built in 1981 for visitors helicoptered<br />
to the inaccessible southwest edge of the<br />
glacier snout, was knocked off of its foun<br />
dation by a large ice block that fell from the<br />
glacier front, which was advancing at the<br />
rate of a meter per day. The hut was re<br />
moved from the site, which now remains<br />
well under the glacier.<br />
lap**:<br />
pppsyssak 1**0 r«5i<br />
- '5f<br />
li^ftit'Mt HK<br />
- .*
1988<br />
1980<br />
1970<br />
1960<br />
1950<br />
1940<br />
0- 1930<br />
LLJ<br />
> 1920<br />
1910<br />
1900<br />
1890<br />
1880<br />
1870<br />
1860<br />
Shelter hut removed<br />
Jokulhlaup" event, December, 1965<br />
Viewing gallery destroyed, 1907<br />
Visit by Haast, 1865<br />
1750 1820<br />
Figure 14. Vertical aerial photographic mosaic of the terminus <strong>and</strong> environs<br />
of the Franz Josef Glacier in 1983 showing outlines of positions of the glacier<br />
front over the past two centuries. The forest trimline of 1820 is particularly evi<br />
dent. Photograph by P. Mosley, Department of Scientific <strong>and</strong> Industrial<br />
Research, Division of Water Sciences, Wellington.<br />
. i>^^-a,^'\<br />
. ^AN* '.iiv' >.. * -' i/»'.ri.-*'
Small glaciers have a short-response time to climatic changes (Chinn,<br />
1975). A comparative study of photographs taken during the past 10<br />
years indicates that they may have recently slowed their retreat. Some<br />
appear to have even reached a steady state. Unfortunately, the fluctua<br />
tions of small glaciers cannot be measured or monitored, because the<br />
spatial resolution of L<strong>and</strong>sat MSS <strong>and</strong> RBV imagery (79-m <strong>and</strong> 30-m pic<br />
ture elements, or pixels, respectively) is not adequate.<br />
Past glacial extents in both the Pleistocene <strong>and</strong> Holocene are fre<br />
quently well depicted on L<strong>and</strong>sat images. The classic Pleistocene<br />
morainal sequences surrounding Lakes Pukaki <strong>and</strong> Tekapo are well dis<br />
played on L<strong>and</strong>sat MSS 'mage 2805-21163 (fig. 15); the outermost tills<br />
are cut by a large canal for a hydroelectric power project. Many of the<br />
moraines associated with tributary cirque <strong>and</strong> valley glaciers also are<br />
clearly portrayed. Possibly the largest Pleistocene lateral moraine pre<br />
served in New Zeal<strong>and</strong> occurs in south Westl<strong>and</strong>, to the west of the<br />
alpine fault. This moraine is shown clearly in the upper lefth<strong>and</strong> part of<br />
L<strong>and</strong>sat MSS image 2824-21211, b<strong>and</strong> 7 (fig. 16). The successive<br />
morainal crests have been progressively moved northeastward by fault<br />
displacement, away from the central flowline of the glacier.<br />
«r <<br />
H44 SATELLITE IMAGE ATLAS OF GLACIERS OF THE WORLD<br />
Figure 15. L<strong>and</strong>sat 2 MSS false-color<br />
composite image (2805-21163; 6 April 1977;<br />
Path 79. Row 91) showing Pleistocene<br />
glacial features <strong>and</strong> moraines around Lakes<br />
Pukaki, Tekapo, <strong>and</strong> Ohau.
IE168-30 El 69-001 E169-38I El 78-801<br />
IEl68-88<br />
25RPR77 C S
Glacier Flow<br />
Although difficult to see on small glaciers, flow directions can be inter<br />
preted on images of the larger glaciers from the patterns of supraglacial<br />
morainal debris (fig. 11). Debris-covered glaciers also show flow struc<br />
tures, particularly arcuate structures, in areas of compressive flow.<br />
Much of this supraglacial material is derived from rockfalls <strong>and</strong> l<strong>and</strong><br />
slides, <strong>and</strong> many of the larger glaciers on the images were found by<br />
aerial or field observation to be transporting individual l<strong>and</strong>slides. These<br />
features consist of isolated arcuate masses of rock distributed trans<br />
versely across the glacier trunk (fig. 17). The rate of glacier flow may be<br />
estimated from these features by measuring displacement between im<br />
ages made some years apart.<br />
Climatic Variations<br />
The elevation of the end-of-summer snowline on a glacier depends on<br />
winter snowfall <strong>and</strong> summer melt, <strong>and</strong> changes in snowline position<br />
from year to year reflect the precipitation <strong>and</strong> temperature regimes for<br />
the previous year. Snowline positions may be delineated on the larger<br />
glaciers, particularly where there is little relief <strong>and</strong> the glacier gradient<br />
is low. The demarcation between snow <strong>and</strong> bare ice shows up as the<br />
boundary between blues <strong>and</strong> whites on L<strong>and</strong>sat MSS color-composite im<br />
ages, or as differences in gray tone on black-<strong>and</strong>-white images (in<br />
dividual L<strong>and</strong>sat MSS b<strong>and</strong>s 4, 5, 6, or 7).<br />
Variations in glacier-snowline position are probably the single best in<br />
dicator of a glacier's health. This line separates the accumulation area<br />
from the ablation area, <strong>and</strong> a rise in snowline elevation above its mean<br />
Figure 17.-Oblique aerial photograph on<br />
14 March 1980 of a recent rock avalanche<br />
that fell onto Murchison Glacier during<br />
December 1979. Such deposits are readily<br />
visible on satellite images. Their movement<br />
<strong>and</strong> distortion enable ice movement to be<br />
monitored by satellite imagery. Photograph<br />
by Trevor J. H. Chinn, New Zeal<strong>and</strong> Geolog<br />
ical Survey, film negative no. 8025.
position indicates a negative glacier balance. Continued annual negative<br />
balances ultimately result in glacier recession. Glacier-snowline eleva<br />
tions have been recorded during studies on the Tasman <strong>and</strong> Ivory<br />
Glaciers (Chinn <strong>and</strong> Bellamy, 1970; Anderton <strong>and</strong> Chinn, 1978; Ander-<br />
ton, 1975) <strong>and</strong> are compared in table 2. During the studies on the Ivory<br />
Glacier, the end-of-season snowlines rose above the upper elevation limit<br />
of the glacier to an indeterminate elevation on the headwall. Therefore,<br />
mass-balance figures are given instead of snowline elevation.<br />
TABLE 2. Glacier-snowline variations with time<br />
Balance year<br />
1966<br />
1967<br />
1968<br />
1969<br />
1970<br />
1971<br />
1972<br />
1973<br />
1974<br />
1975<br />
1976<br />
1977<br />
1978<br />
1979<br />
1980<br />
1981<br />
1982<br />
1983<br />
1984<br />
1985<br />
Tasman Glacier,<br />
snowline elevation<br />
(m)<br />
1,700<br />
1,970<br />
1,630<br />
1,690<br />
2,200<br />
1,930<br />
1,850<br />
1,900<br />
1,700<br />
1,680<br />
1,680<br />
1,770<br />
1,860<br />
1,700<br />
1,810<br />
1,750<br />
1,750<br />
1,740<br />
1,720<br />
1.720<br />
Mean _________ 1,790<br />
1 Approximately one full year only.<br />
Conclusions<br />
Ivory Glacier, area<br />
averaged mass balance<br />
(m)<br />
-2.11 1<br />
1.66 1<br />
1.73<br />
-3.48<br />
4.00<br />
Glaciers are particularly useful for the study of present <strong>and</strong> past<br />
climatic variations. A record of variations in glacier margins <strong>and</strong> glacier-<br />
snowline positions provides a means of accurately documenting yearly<br />
climatic variations, whereas moraines mark previous glacier extents <strong>and</strong><br />
thus record past colder climates. Satellite imagery is a fast <strong>and</strong> regional<br />
ly comprehensive method of documenting all of these glacier features. In<br />
New Zeal<strong>and</strong>, satellite imagery may have its greatest value in estab<br />
lishing past limits of the larger glaciers, because former moraines <strong>and</strong><br />
other subtle ground features clearly show former glacier extent. The<br />
limiting factor of L<strong>and</strong>sat images of New Zeal<strong>and</strong> for glaciological moni<br />
toring is the effective spatial resolution of MSS, L<strong>and</strong>sat 3 RBV, <strong>and</strong><br />
thematic mapper (TM) data (79-m pixels for the MSS, 30-m pixels for the<br />
RBV <strong>and</strong> TM images). Future satellite images, such as photographs<br />
from the Large Format Camera, which have a spatial resolution of 10 m<br />
(equivalent to a 3-m pixel), will result in a major reassessment of the<br />
value of satellite imagery for monitoring fluctuations in New Zeal<strong>and</strong>'s<br />
glaciers.<br />
GLACIERS OF <strong>NEW</strong> <strong>ZEALAND</strong> H47
References Cited<br />
Anderton, P.W., 1973, The significance of perennial snow <strong>and</strong> ice to<br />
the water resources of the South Isl<strong>and</strong>, New Zeal<strong>and</strong>: Journal of<br />
Hydrology (New Zeal<strong>and</strong>), v. 12, no. 1, p. 6-18.<br />
compiler, 1975, Tasman Glacier 1971-73: Wellington, Ministry<br />
of Works <strong>and</strong> Development for the National Water <strong>and</strong> Soil Con<br />
servation Organization, Hydrological Research, Annual Report<br />
No. 33, 28 p.<br />
Anderton, P.W., <strong>and</strong> Chinn, T.J., 1978, Ivory Glacier, New Zeal<strong>and</strong>,<br />
<strong>and</strong> I.H.D. representative basin study: Journal of Glaciology, v.<br />
20, no. 82, p. 67-84.<br />
Andrews, J.T., <strong>and</strong> Miller, G.H., 1972, Quaternary history of the<br />
northern Cumberl<strong>and</strong> Peninsula, Baffin Isl<strong>and</strong>, N.W.T., Canada:<br />
Part IV: Maps of the present glaciation limits <strong>and</strong> lowest equi<br />
librium line altitude for north <strong>and</strong> south Baffin Isl<strong>and</strong>: Arctic <strong>and</strong><br />
Alpine Research, v. 4, no. 1, p. 45-59.<br />
Bell, J.M., 1910, A geographical report on the Franz Josef Glacier,<br />
with topographical maps <strong>and</strong> data by R.P. Grenville <strong>and</strong> botanical<br />
notes by Leonard Cockayne: New Zeal<strong>and</strong> Geological Survey,<br />
Wellington, 14 p.<br />
Bowen, F.E., 1960, Advances <strong>and</strong> retreats of the Franz Josef Glacier:<br />
Journal of Glaciology, v. 3, no, 28, p. 742.<br />
Burrows, C.J., 1975, Late Pleistocene <strong>and</strong> Holocene moraines of the<br />
Cameron Valley, Arrowsmith Range, Canterbury, New Zeal<strong>and</strong>:<br />
Arctic <strong>and</strong> Alpine Research, v. 7, no. 2, p. 125-140.<br />
Burrows, C.J., <strong>and</strong> Maunder, B.R., 1975, The recent moraines of the<br />
Lyell <strong>and</strong> Ramsay Glaciers, Rakaia Valley, Canterbury: Journal of<br />
the Royal Society of New Zeal<strong>and</strong>, v. 5, no. 4, p. 479-491.<br />
Burrows, C.J., <strong>and</strong> Russell, J.B., 1975, Moraines of the Upper Rakaia<br />
Valley: Journal of the Royal Society of New Zeal<strong>and</strong>, v. 5, no. 4, p.<br />
463-477.<br />
Chinn, T.J., 1969, Snow survey techniques in the Waitaki Catchment,<br />
South Canterbury: Journal of Hydrology (New Zeal<strong>and</strong>), v. 8, no.<br />
2, p. 68-76.<br />
1975, Late Quaternary snowlines <strong>and</strong> cirque moraines within<br />
the Waimakariri watershed: M.Sc. thesis, University of Canter<br />
bury, New Zeal<strong>and</strong>, 213 p.<br />
-1979, How wet is the wettest of the wet west coast?: New<br />
Zeal<strong>and</strong> Alpine Journal, v. 32, p. 85-87.<br />
Chinn, T.J., <strong>and</strong> Bellamy, R.J., 1970, Ivory Glacier, representative<br />
basin for the glacial hydrological region: Wellington, Ministry of<br />
Works <strong>and</strong> Development for the National Water <strong>and</strong> Soil Conser<br />
vation Organization, Hydrological Research, Annual Report No. 1,<br />
12 p.<br />
Chinn, T.J., <strong>and</strong> Whitehouse, I.E., 1980, Glacier snow line variations<br />
in the Southern Alps, New Zeal<strong>and</strong>, in World Glacier Inventory,<br />
Riederalp (Switzerl<strong>and</strong>) Workshop, Proceedings: International<br />
Association of Hydrological Sciences, IAHS-AISH Publication<br />
No. 126, p. 219-228.<br />
Ferrigno, J.G., <strong>and</strong> Williams, R.S., Jr., 1983, Limitations is the use of<br />
L<strong>and</strong>sat images for mapping <strong>and</strong> other purposes in snow- <strong>and</strong> ice-<br />
covered regions: Antarctica, Icel<strong>and</strong>, <strong>and</strong> Cape Cod, Massa<br />
chusetts, in Proceedings of the Seventeenth International Sym<br />
posium on Remote Sensing of Environment: Environmental Re<br />
search Institute of Michigan, Ann Arbor, Michigan, v. 1, p.<br />
335-355.<br />
FitzGerald, E.A., 1896, Climbs in the New Zeal<strong>and</strong> Alps: London,<br />
Fisher Unwin, 363 p.<br />
Gellatly, A.F., 1985, Historical records of glacier fluctuations in Mt.<br />
Cook National Park, New Zeal<strong>and</strong>: A century of change: The Geo<br />
graphical Journal, v. 151, no. 1, p. 86-99.<br />
Goldthwaite, R.P., <strong>and</strong> McKellar, I.C., 1962, New Zeal<strong>and</strong> glaciology,<br />
in Wexler, H., <strong>and</strong> others, eds., Antarctic Research: American<br />
Geophysical Union, Geophysical Monograph 7, p. 209-216.<br />
Griffiths, G.A., <strong>and</strong> McSaveney, M.J., 1983, Distribution of mean<br />
annual precipitation across some steepl<strong>and</strong> regions of New<br />
Zeal<strong>and</strong>: New Zeal<strong>and</strong> Journal of Science, v. 26, no. 2, p. 197-209.<br />
H48 SATELLITE IMAGE ATLAS OF GLACIERS OF THE WORLD<br />
Gunn, B.M., 1964, Flow rates <strong>and</strong> secondary structures of Fox <strong>and</strong><br />
Franz Josef Glaciers, New Zeal<strong>and</strong>: Journal of Glaciology, v. 5, no.<br />
38, p. 173-190.<br />
Harper, A.P., 1896, Pioneer work in the Alps of New Zeal<strong>and</strong>; a<br />
record of the first exploration of the chief glaciers <strong>and</strong> ranges of<br />
the Southern Alps: London, T.F. Unwin, 336 p.<br />
1946, Memories of mountains <strong>and</strong> men: Christchurch, Simpson<br />
<strong>and</strong> Williams, Ltd., 208 p.<br />
Heine, A.J., 1962, Glacier changes on Mount Ruapehu, New Zeal<strong>and</strong>,<br />
1957-1961, in Symposium of Obergurgl (Austria), Variations of<br />
the regime of existing glaciers: International Association of Scien<br />
tific Hydrology Publication No. 58, p. 173-178.<br />
Hessell, J.W.D., 1980, Apparent trends of mean temperature in New<br />
Zeal<strong>and</strong> since 1930: New Zeal<strong>and</strong> Journal of Science, v. 23, no. 1,<br />
p. 1-9.<br />
1983, Climatic effects on the recession of the Franz Josef<br />
Glacier: New Zeal<strong>and</strong> Journal of Science, v. 26, no. 3, p. 315-320.<br />
Krenek, L.O., 1959, Changes in the glaciers of Mount Ruapehu: New<br />
Zeal<strong>and</strong> Journal of Geology <strong>and</strong> Geophysics, v. 2, no. 4, p.<br />
643-653.<br />
Mannering, G.E., 1891, With axe <strong>and</strong> rope in the New Zeal<strong>and</strong> Alps:<br />
London, Longman, Green <strong>and</strong> Co., 139 p.<br />
McSaveney, M.J., <strong>and</strong> Gage, M., 1968, Ice flow measurements on<br />
Franz Josef Glacier, New Zeal<strong>and</strong>, in 1966: New Zeal<strong>and</strong> Journal<br />
of Geology <strong>and</strong> Geophysics, v. 11, no. 3, p. 564-592.<br />
Mercer, J.H., 1967, Glaciers of New Zeal<strong>and</strong>, in Southern hemisphere<br />
glacier atlas: Technical Report 67-76-ES by the American<br />
Geographical Society, New York, for the Earth Sciences<br />
Laboratory, U.S. Army Natick Laboratories, Natick,<br />
Massachusetts, Series ES-33, June, p. 209-239.<br />
Odell, N.E., 1955, Mount Ruapehu, New Zeal<strong>and</strong>: Observations on its<br />
crater lake <strong>and</strong> glaciers: Journal of Glaciology, v. 2, no. 18, p.<br />
601-605.<br />
Pascoe, J.D., ed., 1957, Mr. Explorer Douglas: Wellington, A.H. <strong>and</strong><br />
A.W. Reed, 331 p.<br />
Porter, S.C., 1975, Glaciation limit in New Zeal<strong>and</strong>'s Southern Alps:<br />
Arctic <strong>and</strong> Alpine Research, v. 7, no. 1, p. 33-37.<br />
Salinger, M.J., 1976, New Zeal<strong>and</strong> temperatures since 1300 AD:<br />
Nature, v. 260, no. 5549, p. 310-311.<br />
Salinger, M.J., Heine, M.J., <strong>and</strong> Burrows, C.J., 1983, Variations of<br />
the Stocking (Te Wae Wae) Glacier, Mount Cook, <strong>and</strong> climatic<br />
relationships: New Zeal<strong>and</strong> Journal of Science, v. 26, no. 3, p.<br />
321-338.<br />
Sara, W.A., 1968, Franz Josef <strong>and</strong> Fox Glaciers, 1951-67: New<br />
Zeal<strong>and</strong> Journal of Geology <strong>and</strong> Geophysics, v. 11, no. 3, p.<br />
768-780.<br />
1970, Glaciers of Westl<strong>and</strong> National Park: Wellington, New<br />
Zeal<strong>and</strong> Department of Scientific <strong>and</strong> Industrial Research, Infor<br />
mation Series No. 75, 46 p.<br />
Skinner, B.E., 1964, Measurement of twentieth century ice loss on<br />
the Tasman Glacier, New Zeal<strong>and</strong>: New Zeal<strong>and</strong> Journal of<br />
Geology <strong>and</strong> Geophysics, v. 7, no. 4, p. 796-803.<br />
Soons, J.M., 1971, Recent changes in the Franz Josef Glacier, in<br />
Johnston, R.J., <strong>and</strong> Soons, J.M., eds., Proceedings of the Sixth<br />
New Zeal<strong>and</strong> Geography Conference, Christchurch, August 1970:<br />
New Zeal<strong>and</strong> Geographical Society, Conference Series No. 6, v. 1,<br />
p. 195-200.<br />
Speight, R., 1939, Some aspects of glaciation in New Zeal<strong>and</strong>: Report<br />
of the Australian <strong>and</strong> New Zeal<strong>and</strong> Association for the Advance<br />
ment of Science, v. 24, p. 49-71.<br />
Suggate, R.P., 1950, Franz Josef <strong>and</strong> other glaciers of the Southern<br />
Alps, New Zeal<strong>and</strong>: Journal of Glaciology, v. 1, no. 8, p. 422-429.<br />
Thompson, R.D., <strong>and</strong> Kells, B.R., 1973, Mass balance studies on the<br />
Whakapapanui Glacier, New Zeal<strong>and</strong>, in The role of snow <strong>and</strong> ice<br />
in hydrology, Banff Symposium (1972), Proceedings: Interna<br />
tional Association of Hydrological Sciences, IAHS-AISH Publica<br />
tion No. 107, v. 1, no. 1 (Symposium on Properties <strong>and</strong> Processes<br />
(UNESCO)), p. 383-393.<br />
Wardle, P., 1973, Variations of the glaciers of Westl<strong>and</strong> National<br />
Park <strong>and</strong> the Hooker Range, New Zeal<strong>and</strong>: New Zeal<strong>and</strong> Journal<br />
of Botany, v. 11, p. 349-388.


