Statistik der obligatorischen Krankenversicherung 2003 - MZES
Statistik der obligatorischen Krankenversicherung 2003 - MZES
Statistik der obligatorischen Krankenversicherung 2003 - MZES

Sie wollen auch ein ePaper? Erhöhen Sie die Reichweite Ihrer Titel.
YUMPU macht aus Druck-PDFs automatisch weboptimierte ePaper, die Google liebt.
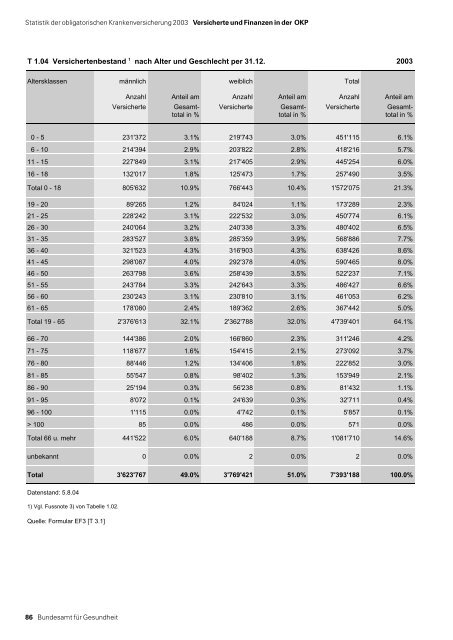
<strong>Statistik</strong> <strong>der</strong> <strong>obligatorischen</strong> <strong>Krankenversicherung</strong> <strong>2003</strong> Versicherte und Finanzen in <strong>der</strong> OKP<br />
T 1.04 Versichertenbestand 1 nach Alter und Geschlecht per 31.12. <strong>2003</strong><br />
Altersklassen männlich weiblich Total<br />
Anzahl Anteil am Anzahl Anteil am Anzahl Anteil am<br />
Versicherte Gesamt- Versicherte Gesamt- Versicherte Gesamttotal<br />
in % total in % total in %<br />
0 - 5 231'372 3.1% 219'743 3.0% 451'115 6.1%<br />
6 - 10 214'394 2.9% 203'822 2.8% 418'216 5.7%<br />
11 - 15 227'849 3.1% 217'405 2.9% 445'254 6.0%<br />
16 - 18 132'017 1.8% 125'473 1.7% 257'490 3.5%<br />
Total 0 - 18 805'632 10.9% 766'443 10.4% 1'572'075 21.3%<br />
19 - 20 89'265 1.2% 84'024 1.1% 173'289 2.3%<br />
21 - 25 228'242 3.1% 222'532 3.0% 450'774 6.1%<br />
26 - 30 240'064 3.2% 240'338 3.3% 480'402 6.5%<br />
31 - 35 283'527 3.8% 285'359 3.9% 568'886 7.7%<br />
36 - 40 321'523 4.3% 316'903 4.3% 638'426 8.6%<br />
41 - 45 298'087 4.0% 292'378 4.0% 590'465 8.0%<br />
46 - 50 263'798 3.6% 258'439 3.5% 522'237 7.1%<br />
51 - 55 243'784 3.3% 242'643 3.3% 486'427 6.6%<br />
56 - 60 230'243 3.1% 230'810 3.1% 461'053 6.2%<br />
61 - 65 178'080 2.4% 189'362 2.6% 367'442 5.0%<br />
Total 19 - 65 2'376'613 32.1% 2'362'788 32.0% 4'739'401 64.1%<br />
66 - 70 144'386 2.0% 166'860 2.3% 311'246 4.2%<br />
71 - 75 118'677 1.6% 154'415 2.1% 273'092 3.7%<br />
76 - 80 88'446 1.2% 134'406 1.8% 222'852 3.0%<br />
81 - 85 55'547 0.8% 98'402 1.3% 153'949 2.1%<br />
86 - 90 25'194 0.3% 56'238 0.8% 81'432 1.1%<br />
91 - 95 8'072 0.1% 24'639 0.3% 32'711 0.4%<br />
96 - 100 1'115 0.0% 4'742 0.1% 5'857 0.1%<br />
> 100 85 0.0% 486 0.0% 571 0.0%<br />
Total 66 u. mehr 441'522 6.0% 640'188 8.7% 1'081'710 14.6%<br />
unbekannt 0 0.0% 2 0.0% 2 0.0%<br />
Total 3'623'767 49.0% 3'769'421 51.0% 7'393'188 100.0%<br />
Datenstand: 5.8.04<br />
1) Vgl. Fussnote 3) von Tabelle 1.02.<br />
Quelle: Formular EF3 [T 3.1]<br />
86 Bundesamt für Gesundheit