Mosaic Plots (mit einer Zielvariable)
Mosaic Plots (mit einer Zielvariable)
Mosaic Plots (mit einer Zielvariable)

Erfolgreiche ePaper selbst erstellen
Machen Sie aus Ihren PDF Publikationen ein blätterbares Flipbook mit unserer einzigartigen Google optimierten e-Paper Software.
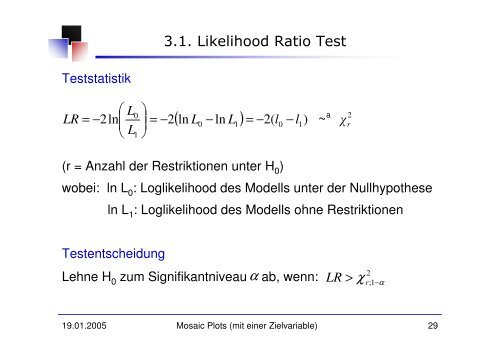
3.1. Likelihood Ratio Test<br />
Teststatistik<br />
LR<br />
= −<br />
⎛<br />
⎜<br />
⎝<br />
L<br />
⎞<br />
⎟<br />
⎠<br />
2<br />
( ln L − ln L ) = −2(<br />
l − l ~ a χ<br />
0<br />
2ln⎜<br />
= −2<br />
0 1<br />
0 1)<br />
r<br />
L ⎟<br />
1<br />
(r = Anzahl der Restriktionen unter H 0 )<br />
wobei: ln L 0<br />
: Loglikelihood des Modells unter der Nullhypothese<br />
ln L 1 : Loglikelihood des Modells ohne Restriktionen<br />
Testentscheidung<br />
α<br />
Lehne H 0 zum Signifikantniveau ab, wenn:<br />
LR > χ r<br />
2<br />
; 1 − α<br />
19.01.2005 <strong>Mosaic</strong> <strong>Plots</strong> (<strong>mit</strong> <strong>einer</strong> <strong>Zielvariable</strong>) 29