2002 - Volume 1 - JEFF. Journal of Engineered Fibers and Fabrics
2002 - Volume 1 - JEFF. Journal of Engineered Fibers and Fabrics
2002 - Volume 1 - JEFF. Journal of Engineered Fibers and Fabrics

You also want an ePaper? Increase the reach of your titles
YUMPU automatically turns print PDFs into web optimized ePapers that Google loves.
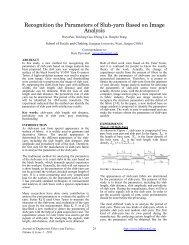
mixture after soaking during 360s depends upon quantity <strong>of</strong><br />
SAP, but this dependence is not proportional; for instance, the<br />
increase <strong>of</strong> the quantity <strong>of</strong> SAP from 5 till 50%, i.e. at 10<br />
times, is accompanied by the growth <strong>of</strong> AC only at 50%, i.e.<br />
0.5 time. This fact proves the unsuitability <strong>of</strong> using this mixture<br />
with content <strong>of</strong> SAP more than 30% because it is not<br />
expedient.<br />
The second cause <strong>of</strong> the application <strong>of</strong> the restricted quantity<br />
<strong>of</strong> SAP is ability <strong>of</strong> the swelled particles <strong>of</strong> SAP to<br />
migrate in the wet core under pressure <strong>and</strong> by change <strong>of</strong> the<br />
adult’s posture.<br />
The reduction <strong>of</strong> AC <strong>of</strong> the mixture <strong>of</strong> wood pulp <strong>and</strong> SAP<br />
can be explained by the result <strong>of</strong> the comparison <strong>of</strong> the<br />
accounted <strong>and</strong> experimental values AC <strong>and</strong> ACrm for the<br />
double mixtures (Table 4) by soaking during 360s. The correlation<br />
coefficient between these two groups <strong>of</strong> the values is<br />
very high (r = 0.98 <strong>and</strong> 0.94), this fact points out the absence<br />
<strong>of</strong> interaction between SAP <strong>and</strong> cellulosic fibers, that may be<br />
14 INJ Spring <strong>2002</strong> 2<br />
the cause <strong>of</strong> the obviation <strong>of</strong> mechanical hindrance to the<br />
swelling <strong>of</strong> SAP. At the initial period <strong>of</strong> time (60s) the coefficient<br />
correlation between the accounted <strong>and</strong> experimental<br />
values is low, what is stipulated by the difference in the rate<br />
<strong>of</strong> swelling <strong>of</strong> cellulosic fiber <strong>and</strong> superabsorbent due to their<br />
properties.<br />
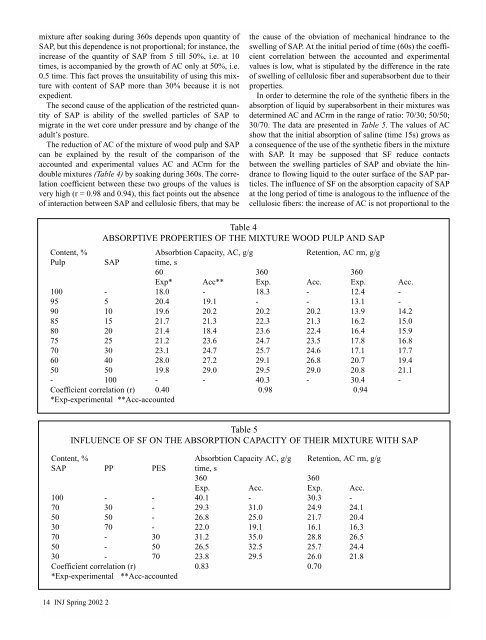
In order to determine the role <strong>of</strong> the synthetic fibers in the<br />
absorption <strong>of</strong> liquid by superabsorbent in their mixtures was<br />
determined AC <strong>and</strong> ACrm in the range <strong>of</strong> ratio: 70/30; 50/50;<br />
30/70. The data are presented in Table 5. The values <strong>of</strong> AC<br />
show that the initial absorption <strong>of</strong> saline (time 15s) grows as<br />
a consequence <strong>of</strong> the use <strong>of</strong> the synthetic fibers in the mixture<br />
with SAP. It may be supposed that SF reduce contacts<br />
between the swelling particles <strong>of</strong> SAP <strong>and</strong> obviate the hindrance<br />
to flowing liquid to the outer surface <strong>of</strong> the SAP particles.<br />
The influence <strong>of</strong> SF on the absorption capacity <strong>of</strong> SAP<br />
at the long period <strong>of</strong> time is analogous to the influence <strong>of</strong> the<br />
cellulosic fibers: the increase <strong>of</strong> AC is not proportional to the<br />
Table 4<br />
ABSORPTIVE PROPERTIES OF THE MIXTURE WOOD PULP AND SAP<br />
Content, % Absorbtion Capacity, AC, g/g Retention, AC rm, g/g<br />
Pulp SAP time, s<br />
60 360 360<br />
Exp* Acc** Exp. Acc. Exp. Acc.<br />
100 - 18.0 - 18.3 - 12.4 -<br />
95 5 20.4 19.1 - - 13.1 -<br />
90 10 19.6 20.2 20.2 20.2 13.9 14.2<br />
85 15 21.7 21.3 22.3 21.3 16.2 15.0<br />
80 20 21.4 18.4 23.6 22.4 16.4 15.9<br />
75 25 21.2 23.6 24.7 23.5 17.8 16.8<br />
70 30 23.1 24.7 25.7 24.6 17.1 17.7<br />
60 40 28.0 27.2 29.1 26.8 20.7 19.4<br />
50 50 19.8 29.0 29.5 29.0 20.8 21.1<br />
- 100 - - 40.3 - 30.4 -<br />
Coefficient correlation (r) 0.40 0.98 0.94<br />
*Exp-experimental **Acc-accounted<br />
Table 5<br />
INFLUENCE OF SF ON THE ABSORPTION CAPACITY OF THEIR MIXTURE WITH SAP<br />
Content, % Absorbtion Capacity AC, g/g Retention, AC rm, g/g<br />
SAP PPES time, s<br />
360 360<br />
Exp. Acc. Exp. Acc.<br />
100 - - 40.1 - 30.3 -<br />
70 30 - 29.3 31.0 24.9 24.1<br />
50 50 - 26.8 25.0 21.7 20.4<br />
30 70 - 22.0 19.1 16.1 16.3<br />
70 - 30 31.2 35.0 28.8 26.5<br />
50 - 50 26.5 32.5 25.7 24.4<br />
30 - 70 23.8 29.5 26.0 21.8<br />
Coefficient correlation (r) 0.83 0.70<br />
*Exp-experimental **Acc-accounted