2002 - Volume 1 - JEFF. Journal of Engineered Fibers and Fabrics
2002 - Volume 1 - JEFF. Journal of Engineered Fibers and Fabrics
2002 - Volume 1 - JEFF. Journal of Engineered Fibers and Fabrics

Create successful ePaper yourself
Turn your PDF publications into a flip-book with our unique Google optimized e-Paper software.
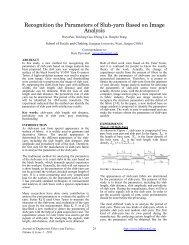
Figure 8<br />
Linear relationship between the mean number <strong>of</strong> contacts<br />
per fiber <strong>and</strong> fiber crimp. For crimp increasing from k=1.0<br />
to k=4. statistics for isotropic samples: r<strong>and</strong>om data are<br />
displayed as squares <strong>and</strong> flocculated data are displayed as<br />
x-marks; statistics for anisotropic samples: r<strong>and</strong>om data<br />
are displayed as hexagram, <strong>and</strong> flocculated data are displayed<br />
as points. In general, higher fiber crimp implies<br />
higher mean number <strong>of</strong> contacts per fiber.<br />
Figure 9<br />
Linear relationship between the mean number <strong>of</strong> fiber per<br />
zone <strong>and</strong> fiber crimp. For crimp increasing from k=1.0 to<br />
k=4.0: statistics for isotropic samples: r<strong>and</strong>om data are<br />
displayed as squares <strong>and</strong> flocculated data are displayed as<br />
x-marks;<br />
statistics for anisotropic samples: r<strong>and</strong>om data are displayed<br />
as hexagram, <strong>and</strong> flocculated data are displayed as<br />
points. In general, higher fiber crimp implies in higher<br />
mean number <strong>of</strong> fibers per zone. Fiber crimp has a higher<br />
impact on isotropic structures, than on anisotropic structures.<br />
Also, isotropic structures tend to present higher mean<br />
number <strong>of</strong> fibers per zone, as crimp is increased.<br />
process control instruments could be devised to exploit our<br />
methods <strong>and</strong> results.<br />
We find that mean <strong>and</strong> st<strong>and</strong>ard deviation are positively<br />
correlated for some fiber network parameters, such as<br />
28 INJ Spring <strong>2002</strong> 2<br />
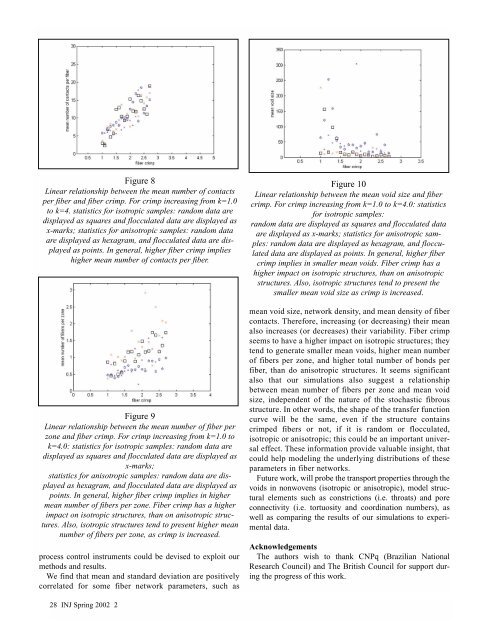
Figure 10<br />
Linear relationship between the mean void size <strong>and</strong> fiber<br />
crimp. For crimp increasing from k=1.0 to k=4.0: statistics<br />
for isotropic samples:<br />
r<strong>and</strong>om data are displayed as squares <strong>and</strong> flocculated data<br />
are displayed as x-marks; statistics for anisotropic samples:<br />
r<strong>and</strong>om data are displayed as hexagram, <strong>and</strong> flocculated<br />
data are displayed as points. In general, higher fiber<br />
crimp implies in smaller mean voids. Fiber crimp has a<br />
higher impact on isotropic structures, than on anisotropic<br />
structures. Also, isotropic structures tend to present the<br />
smaller mean void size as crimp is increased.<br />
mean void size, network density, <strong>and</strong> mean density <strong>of</strong> fiber<br />
contacts. Therefore, increasing (or decreasing) their mean<br />
also increases (or decreases) their variability. Fiber crimp<br />
seems to have a higher impact on isotropic structures; they<br />
tend to generate smaller mean voids, higher mean number<br />
<strong>of</strong> fibers per zone, <strong>and</strong> higher total number <strong>of</strong> bonds per<br />
fiber, than do anisotropic structures. It seems significant<br />
also that our simulations also suggest a relationship<br />
between mean number <strong>of</strong> fibers per zone <strong>and</strong> mean void<br />
size, independent <strong>of</strong> the nature <strong>of</strong> the stochastic fibrous<br />
structure. In other words, the shape <strong>of</strong> the transfer function<br />
curve will be the same, even if the structure contains<br />
crimped fibers or not, if it is r<strong>and</strong>om or flocculated,<br />
isotropic or anisotropic; this could be an important universal<br />
effect. These information provide valuable insight, that<br />
could help modeling the underlying distributions <strong>of</strong> these<br />
parameters in fiber networks.<br />
Future work, will probe the transport properties through the<br />
voids in nonwovens (isotropic or anisotropic), model structural<br />
elements such as constrictions (i.e. throats) <strong>and</strong> pore<br />
connectivity (i.e. tortuosity <strong>and</strong> coordination numbers), as<br />
well as comparing the results <strong>of</strong> our simulations to experimental<br />
data.<br />
Acknowledgements<br />
The authors wish to thank CNPq (Brazilian National<br />
Research Council) <strong>and</strong> The British Council for support during<br />
the progress <strong>of</strong> this work.