2002 - Volume 1 - JEFF. Journal of Engineered Fibers and Fabrics
2002 - Volume 1 - JEFF. Journal of Engineered Fibers and Fabrics
2002 - Volume 1 - JEFF. Journal of Engineered Fibers and Fabrics

Create successful ePaper yourself
Turn your PDF publications into a flip-book with our unique Google optimized e-Paper software.
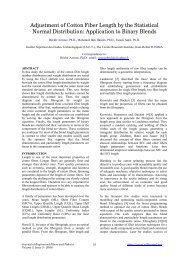
Figure 3<br />
DISCONTINUITIES AT THE EDGES OF THE FIBER<br />
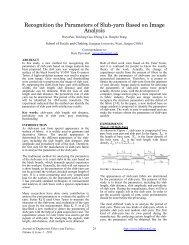
Figure 4<br />
FFT FILTERED IMAGES WITH (LEFT) AND<br />
WITHOUT (RIGHT) WINDOWING FUNCTION<br />
If the fiber axis is not perfectly perpendicular to the fringe<br />
field or is not perfectly focused, discontinuities will occur at<br />
the edges <strong>of</strong> the fiber. This is demonstrated in Figure 3. In this<br />
case, the frequency image will contain erroneous spatial frequency<br />
components because the Fourier Transform will<br />
attempt to model the discontinuities as part <strong>of</strong> the signal. This<br />
problem can be somewhat reduced by using windowing functions<br />
(Figure 4). Windowing functions attempt to reduce the<br />
edge discontinuities thereby minimizing spatial distortion<br />
artifacts [5]. Note however, that while windowing functions<br />
may reduce the spatial frequency errors, they cannot eliminate<br />
the problem entirely. When digitizing images, it is therefore,<br />
critical to ensure that<br />
1. the image is in focus<br />
2. the fringe field is perpendicular to the direction <strong>of</strong> scan.<br />
Wu <strong>and</strong> Davis discussed the difficulties associated with<br />
applying FFT to remove noise <strong>and</strong> edge distortions <strong>and</strong> developed<br />
a minimization technique to extract the fundamental frequency<br />
<strong>of</strong> the fringe pattern [6]. Instead, we choose to introduce<br />
a Dirac delta function (or the unit impulse function)<br />
given by:<br />
Where p r is a dominant spatial frequency <strong>of</strong> fringe pattern<br />
taken between 1 <strong>and</strong> N.<br />
Usually, a Dirac delta function is introduced to solve problems<br />
involving short impulses. To h<strong>and</strong>le our case, we con-<br />
20 INJ Spring <strong>2002</strong><br />
(7)<br />
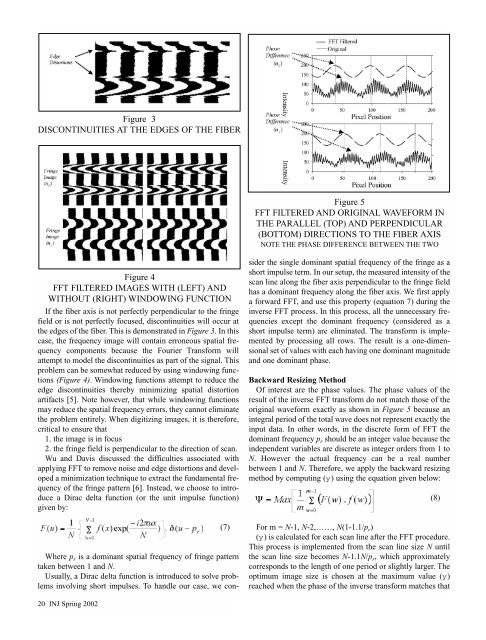
Figure 5<br />
FFT FILTERED AND ORIGINAL WAVEFORM IN<br />
THE PARALLEL (TOP) AND PERPENDICULAR<br />
(BOTTOM) DIRECTIONS TO THE FIBER AXIS<br />
NOTE THE PHASE DIFFERENCE BETWEEN THE TWO<br />
sider the single dominant spatial frequency <strong>of</strong> the fringe as a<br />
short impulse term. In our setup, the measured intensity <strong>of</strong> the<br />
scan line along the fiber axis perpendicular to the fringe field<br />
has a dominant frequency along the fiber axis. We first apply<br />
a forward FFT, <strong>and</strong> use this property (equation 7) during the<br />
inverse FFT process. In this process, all the unnecessary frequencies<br />
except the dominant frequency (considered as a<br />
short impulse term) are eliminated. The transform is implemented<br />
by processing all rows. The result is a one-dimensional<br />
set <strong>of</strong> values with each having one dominant magnitude<br />
<strong>and</strong> one dominant phase.<br />
Backward Resizing Method<br />
Of interest are the phase values. The phase values <strong>of</strong> the<br />
result <strong>of</strong> the inverse FFT transform do not match those <strong>of</strong> the<br />
original waveform exactly as shown in Figure 5 because an<br />
integral period <strong>of</strong> the total wave does not represent exactly the<br />
input data. In other words, in the discrete form <strong>of</strong> FFT the<br />
dominant frequency p r should be an integer value because the<br />
independent variables are discrete as integer orders from 1 to<br />
N. However the actual frequency can be a real number<br />
between 1 <strong>and</strong> N. Therefore, we apply the backward resizing<br />
method by computing (y) using the equation given below:<br />
(8)<br />
For m = N-1, N-2,……, N(1-1.1/p r)<br />
(y) is calculated for each scan line after the FFT procedure.<br />
This process is implemented from the scan line size N until<br />
the scan line size becomes N-1.1N/p r, which approximately<br />
corresponds to the length <strong>of</strong> one period or slightly larger. The<br />
optimum image size is chosen at the maximum value (y)<br />
reached when the phase <strong>of</strong> the inverse transform matches that