2002 - Volume 1 - JEFF. Journal of Engineered Fibers and Fabrics
2002 - Volume 1 - JEFF. Journal of Engineered Fibers and Fabrics
2002 - Volume 1 - JEFF. Journal of Engineered Fibers and Fabrics

Create successful ePaper yourself
Turn your PDF publications into a flip-book with our unique Google optimized e-Paper software.
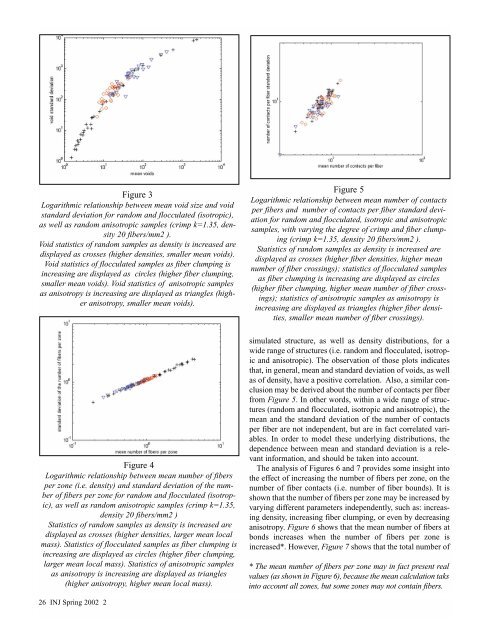
Figure 3<br />
Logarithmic relationship between mean void size <strong>and</strong> void<br />
st<strong>and</strong>ard deviation for r<strong>and</strong>om <strong>and</strong> flocculated (isotropic),<br />
as well as r<strong>and</strong>om anisotropic samples (crimp k=1.35, density<br />
20 fibers/mm2 ).<br />
Void statistics <strong>of</strong> r<strong>and</strong>om samples as density is increased are<br />
displayed as crosses (higher densities, smaller mean voids).<br />
Void statistics <strong>of</strong> flocculated samples as fiber clumping is<br />
increasing are displayed as circles (higher fiber clumping,<br />
smaller mean voids). Void statistics <strong>of</strong> anisotropic samples<br />
as anisotropy is increasing are displayed as triangles (higher<br />
anisotropy, smaller mean voids).<br />
Figure 4<br />
Logarithmic relationship between mean number <strong>of</strong> fibers<br />
per zone (i.e. density) <strong>and</strong> st<strong>and</strong>ard deviation <strong>of</strong> the number<br />
<strong>of</strong> fibers per zone for r<strong>and</strong>om <strong>and</strong> flocculated (isotropic),<br />
as well as r<strong>and</strong>om anisotropic samples (crimp k=1.35,<br />
density 20 fibers/mm2 )<br />
Statistics <strong>of</strong> r<strong>and</strong>om samples as density is increased are<br />
displayed as crosses (higher densities, larger mean local<br />
mass). Statistics <strong>of</strong> flocculated samples as fiber clumping is<br />
increasing are displayed as circles (higher fiber clumping,<br />
larger mean local mass). Statistics <strong>of</strong> anisotropic samples<br />
as anisotropy is increasing are displayed as triangles<br />
(higher anisotropy, higher mean local mass).<br />
26 INJ Spring <strong>2002</strong> 2<br />
Figure 5<br />
Logarithmic relationship between mean number <strong>of</strong> contacts<br />
per fibers <strong>and</strong> number <strong>of</strong> contacts per fiber st<strong>and</strong>ard deviation<br />
for r<strong>and</strong>om <strong>and</strong> flocculated, isotropic <strong>and</strong> anisotropic<br />
samples, with varying the degree <strong>of</strong> crimp <strong>and</strong> fiber clumping<br />
(crimp k=1.35, density 20 fibers/mm2 ).<br />
Statistics <strong>of</strong> r<strong>and</strong>om samples as density is increased are<br />
displayed as crosses (higher fiber densities, higher mean<br />
number <strong>of</strong> fiber crossings); statistics <strong>of</strong> flocculated samples<br />
as fiber clumping is increasing are displayed as circles<br />
(higher fiber clumping, higher mean number <strong>of</strong> fiber crossings);<br />
statistics <strong>of</strong> anisotropic samples as anisotropy is<br />
increasing are displayed as triangles (higher fiber densities,<br />
smaller mean number <strong>of</strong> fiber crossings).<br />
simulated structure, as well as density distributions, for a<br />
wide range <strong>of</strong> structures (i.e. r<strong>and</strong>om <strong>and</strong> flocculated, isotropic<br />
<strong>and</strong> anisotropic). The observation <strong>of</strong> those plots indicates<br />
that, in general, mean <strong>and</strong> st<strong>and</strong>ard deviation <strong>of</strong> voids, as well<br />
as <strong>of</strong> density, have a positive correlation. Also, a similar conclusion<br />
may be derived about the number <strong>of</strong> contacts per fiber<br />
from Figure 5. In other words, within a wide range <strong>of</strong> structures<br />
(r<strong>and</strong>om <strong>and</strong> flocculated, isotropic <strong>and</strong> anisotropic), the<br />
mean <strong>and</strong> the st<strong>and</strong>ard deviation <strong>of</strong> the number <strong>of</strong> contacts<br />
per fiber are not independent, but are in fact correlated variables.<br />
In order to model these underlying distributions, the<br />
dependence between mean <strong>and</strong> st<strong>and</strong>ard deviation is a relevant<br />
information, <strong>and</strong> should be taken into account.<br />
The analysis <strong>of</strong> Figures 6 <strong>and</strong> 7 provides some insight into<br />
the effect <strong>of</strong> increasing the number <strong>of</strong> fibers per zone, on the<br />
number <strong>of</strong> fiber contacts (i.e. number <strong>of</strong> fiber bounds). It is<br />
shown that the number <strong>of</strong> fibers per zone may be increased by<br />
varying different parameters independently, such as: increasing<br />
density, increasing fiber clumping, or even by decreasing<br />
anisotropy. Figure 6 shows that the mean number <strong>of</strong> fibers at<br />
bonds increases when the number <strong>of</strong> fibers per zone is<br />
increased*. However, Figure 7 shows that the total number <strong>of</strong><br />
* The mean number <strong>of</strong> fibers per zone may in fact present real<br />
values (as shown in Figure 6), because the mean calculation taks<br />
into account all zones, but some zones may not contain fibers.