2002 - Volume 1 - JEFF. Journal of Engineered Fibers and Fabrics
2002 - Volume 1 - JEFF. Journal of Engineered Fibers and Fabrics
2002 - Volume 1 - JEFF. Journal of Engineered Fibers and Fabrics

Create successful ePaper yourself
Turn your PDF publications into a flip-book with our unique Google optimized e-Paper software.
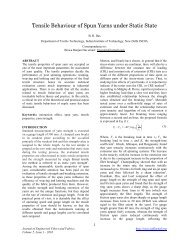
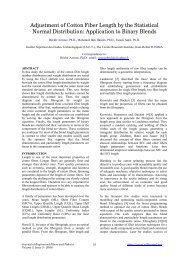
Figure 1<br />
ORIGINAL INTERFERENCE MICROSCOPE IMAGE<br />
(TOP) AND THRESHLODED IMAGE<br />
(BOTTOM)<br />
gral period <strong>of</strong> the total waveform. Consequently the fundamental<br />
frequency <strong>and</strong> phase information derived by the FFT<br />
approach will not represent the true single spatial frequency<br />
associated with a fringe pattern. The problems associated with<br />
edge discontinuities have been discussed before [5].<br />
2. The distortion <strong>of</strong> a signal by noise may cause the FFT to<br />
yield several frequencies.<br />
The deviation <strong>of</strong> the fundamental frequency depends on the<br />
noise pattern, <strong>and</strong> thus is unpredictable <strong>and</strong> r<strong>and</strong>om [6].<br />
Below, we propose a new scheme for automatic contour<br />
extracting, by<br />
1. extracting interference fringes by eliminating noise components<br />
that cause the distortion <strong>of</strong> a signal <strong>and</strong> lead to errors<br />
in computing the dominant frequency <strong>and</strong> phase <strong>of</strong> the fringe<br />
patterns, <strong>and</strong><br />
2. removing the edge discontinuities by means <strong>of</strong> redefining<br />
the data size (hereafter referred to as backward resizing<br />
method) so as to represent exactly an integral period <strong>of</strong> the<br />
total waveform.<br />
Noise Filtering<br />
Among the great many varieties <strong>of</strong> instrumental configurations,<br />
the Mach-Zender interferometer occupies an important<br />
position for applications in light microscopy. This configuration<br />
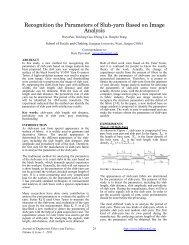
is depicted in Figure 2. Mach-Zender interference system<br />
consists <strong>of</strong> two semi-silvered plates (S 1 <strong>and</strong> S 2) <strong>and</strong> two<br />
fully-silvered mirrors (T 1 <strong>and</strong> T 2 ) arranged symmetrically at<br />
45 o at the corners <strong>of</strong> rectangle. A parallel light beam is split<br />
into a transmitted component <strong>and</strong> a reflected component.<br />
The extent <strong>of</strong> deformation depends on the optical path difference<br />
(Dl) introduced by varying the angle (b) at mirror T 2.<br />
The optical path difference interferes to produce visible interference<br />
patterns. The optical path difference is expressed as<br />
follows:<br />
The total number <strong>of</strong> fringe (N) at OP is<br />
²<br />
(1)<br />
(2)<br />
Figure 2<br />
INSTRUMENTAL CONFIGURATION OF THE<br />
MACH-ZENDER INTERFEROMETER<br />
Where l = wave length <strong>and</strong> b = length <strong>of</strong> P’P<br />
The width <strong>of</strong> fringe (B) is<br />
In this system, the measured intensity <strong>of</strong> any scan line along<br />
the fiber axis perpendicular to the fringe field is theoretically<br />
a periodic function with the width <strong>of</strong> fringe B <strong>and</strong> the dominant<br />
frequency does not change with position.<br />
The same optical path difference (Dl) is chosen at the fringe<br />
interval <strong>of</strong> the width <strong>of</strong> the fringe (B) by fixing angle (b) at<br />
mirror T 2 <strong>and</strong> fixing the wave length (551 nm). Therefore this<br />
leads to the one dominant spatial frequency. The fringe image<br />
represents the spatial details in the form <strong>of</strong> brightness transitions.<br />
Consequently, we can apply the Fast Fourier Transform<br />
to decompose the signal <strong>and</strong> extract the dominant frequency.<br />
When a fiber is inserted into the fringe field, because <strong>of</strong> the<br />
refractive index different between the fiber <strong>and</strong> liquid, fringes<br />
inside the fiber image are shifted. FFT has been used to<br />
extract fringe contours as the phase differences introduced by<br />
re-combining the light beam that runs along the reference<br />
beam-path <strong>and</strong> along the object beam-path. In one dimension,<br />
the corresponding direct Fourier Transform is givens as<br />
Where f(x) is the image <strong>and</strong> F(u) is its transform, u refers to<br />
the frequency along x direction.<br />
For a full description <strong>of</strong> the Fourier Transform <strong>of</strong> a continuous<br />
function see reference 7. In discrete form, a continuous<br />
function, such as f(x), is discretized into a sequence<br />
by taking N samples Dx units apart. Thus<br />
Where k assumes the discrete values 0, 1, 2, ...., N-1.<br />
For u = 0, 1, 2, ...., N-1, <strong>and</strong><br />
(6)<br />
(3)<br />
(4)<br />
(5)<br />
INJ Spring <strong>2002</strong> 19