- Page 1 and 2:
Washington State Regional Haze Stat
- Page 3 and 4:
co-chaired by a state and a tribal
- Page 5 and 6:
Membership Members Air program dire
- Page 7 and 8:
Sample Contribution Matrix for Supp
- Page 9 and 10:
� DRAFT 308 Regional Haze SIP/TIP
- Page 11 and 12:
2002 Events: 2001 Events: 2000 Even
- Page 13 and 14:
2001 Events: 2000 Events: 1999 Even
- Page 15 and 16:
2000 Events: 11/09/00 IOC Meeting A
- Page 17 and 18:
2003 Events: 2002 Events: 2001 Even
- Page 19 and 20:
03/15/01 Forum Meeting Summary, Sac
- Page 21 and 22:
2003 Events: 2002 Events: o Recent
- Page 23 and 24:
actual emissions, and forecasts the
- Page 25 and 26:
2001 Events: 09/27/01 Emissions For
- Page 27 and 28:
2002 Events: 12/10/03 FEJF Meeting,
- Page 29 and 30:
2000 Events: 06/07/00 Mobile Source
- Page 31 and 32:
o Status of WRAP comments on BART r
- Page 33 and 34:
Meetings 2007 Events: 2006 Events:
- Page 35 and 36:
Washington State Regional Haze Stat
- Page 37 and 38:
Section B-1 Overview of Appendix B
- Page 39 and 40:
B-5 Final December 2010
- Page 41 and 42:
Final December 2010 Section B-3 Eco
- Page 43 and 44:
Final December 2010 and Organic Car
- Page 45 and 46:
Final December 2010 Response: Ecolo
- Page 47 and 48:
B-13 Final December 2010
- Page 49 and 50:
B-15 Final December 2010
- Page 51 and 52:
B-17 Final December 2010
- Page 53 and 54:
B-19 Final December 2010
- Page 55 and 56:
B-21 Final December 2010
- Page 57 and 58:
Section B-5 Ecology’s Summary of
- Page 59 and 60:
Final December 2010 While Ecology n
- Page 61 and 62:
improve very slowly. Consider the p
- Page 63 and 64:
United States Department of Agricul
- Page 65 and 66:
Mr. Doug Schneider Reasonable Progr
- Page 67 and 68:
Mr. Doug Schneider We also encourag
- Page 69 and 70:
Mr. Doug Schneider pollution of the
- Page 71 and 72:
Clint: Herman Wong/R10/USEPA/US 07/
- Page 73 and 74:
Wilson.Rob@epamail.epa.gov 06/08/20
- Page 75 and 76:
B-41 Final December 2010
- Page 77 and 78:
Washington State Regional Haze Stat
- Page 79 and 80:
Inversions/Trapping Temperature inv
- Page 81 and 82:
each to 1,500 m or higher which cou
- Page 83 and 84:
Inversions/Trapping The PASA1 site
- Page 85 and 86:
WRAP IMPROVE Data Substitutions 04/
- Page 87 and 88:
Additional Data Substitutions This
- Page 89 and 90:
2. Donor Site Substitutions In the
- Page 91 and 92:
2. Data Completeness Following Subs
- Page 93 and 94:
Results for Washington Sites The ch
- Page 95 and 96:
Extinction (Mm -1 ) Extinction (Mm
- Page 97 and 98:
OC (µg/m³) OC (µg/m³) 10 8 6 4
- Page 99 and 100:
AmmSO 4 (µg/m³) AmmSO 4 (µg/m³)
- Page 101 and 102:
OC (µg/m³) OC (µg/m³) 5 4 3 2 1
- Page 103 and 104:
Soil (µg/m³) Soil (µg/m³) 5 4 3
- Page 105 and 106:
SS (µg/m³) SS (µg/m³) 5 4 3 2 1
- Page 107 and 108:
Overview This appendix consists of
- Page 109 and 110:
Class I Area Visibility Summary: Ol
- Page 111 and 112:
Class I Area Visibility Summary: Gl
- Page 113 and 114:
Class I Area Visibility Summary: Al
- Page 115 and 116:
Class I Area Visibility Summary: Mo
- Page 117 and 118:
Class I Area Visibility Summary: Go
- Page 119 and 120:
Class I Area Visibility Summary: Pa
- Page 121 and 122:
period used as baseline data for th
- Page 123 and 124:
Washington State Regional Haze Stat
- Page 125 and 126:
Class I Area Summary Tables - Olymp
- Page 127 and 128:
Class I Area Summary Tables - North
- Page 129 and 130:
Class I Area Summary Tables - Alpin
- Page 131 and 132:
Class I Area Summary Tables - Mount
- Page 133 and 134:
Class I Area Summary Tables - Goat
- Page 135 and 136:
Class I Area Summary Tables - Pasay
- Page 137 and 138:
NOCA1 Revised 2018 Visibility Proje
- Page 139 and 140:
and annual average mass and extinct
- Page 141 and 142:
Overview Ecology developed a set of
- Page 143 and 144:
Table 1 Washington Source Category
- Page 145 and 146:
Final December 2010 Major Category
- Page 147 and 148:
Final December 2010 Major Category
- Page 149 and 150:
Table 5 Specific Industries and Emi
- Page 151 and 152:
at the Alcoa Wenatchee Works facili
- Page 153 and 154:
expansion of sulfur recovery system
- Page 155 and 156:
3. Petroleum Industry Catalytic Cra
- Page 157 and 158:
All emission controls systems avail
- Page 159 and 160:
Table 8 Summary of Emission Control
- Page 161 and 162:
It will take 1-2 years to complete
- Page 163 and 164:
with the lime/limestone in water dr
- Page 165 and 166:
Based on the above, it is Ecology
- Page 167 and 168:
Conclusions from the Four-Factor an
- Page 169 and 170:
Scope of Document This document pro
- Page 171 and 172:
10. Oil Refineries ................
- Page 173 and 174:
STAPPA State and Territorial Air Po
- Page 175 and 176:
We have identified control measures
- Page 177 and 178:
The U.S. EPA’s Guidance for Setti
- Page 179 and 180:
The ages of major pieces of equipme
- Page 181 and 182:
Table 3-1. Emissions from Reciproca
- Page 183 and 184:
Baseline Potential emission emissio
- Page 185 and 186:
3.2 Factor 2 - Time Necessary for C
- Page 187 and 188:
3.4 Factor 4 - Remaining Equipment
- Page 189 and 190:
4. Oil and Gas Exploration and Prod
- Page 191 and 192:
Table 4-1. Emissions from Oil and G
- Page 193 and 194:
Turbines Table 4-2. Control Options
- Page 195 and 196:
educe NOX emissions from process he
- Page 197 and 198:
Table 4-3. Estimated Costs of Contr
- Page 199 and 200:
Table 4-4. Estimated Energy and Non
- Page 201 and 202:
4.4 Factor 4 - Remaining Equipment
- Page 203 and 204:
20. EPA (2002), EPA Air Pollution C
- Page 205 and 206:
Emission source AK CA CO MT ND NM N
- Page 207 and 208:
turbines. 3,4,5,6,7,8 Reciprocating
- Page 209 and 210:
Estimated Estimated Estimated annua
- Page 211 and 212:
Sulfur recovery units require elect
- Page 213 and 214:
16 . Ghoreishi, Farrokh (2007), Tim
- Page 215 and 216:
industrial boiler control option st
- Page 217 and 218:
Source Type Coal-fired Oil-fired Ta
- Page 219 and 220:
Source Type Coal-fired (Pre PSD Reg
- Page 221 and 222:
6.1 Factor 1 - Costs Table 6-3 prov
- Page 223 and 224:
Table 6-4. Estimated Energy and Non
- Page 225 and 226:
6.5 References for Section 6 1. Ene
- Page 227 and 228:
urners reduce flame turbulence, del
- Page 229 and 230:
Table 7-1. Emissions from Cement Ki
- Page 231 and 232:
Table 7-2. Control Options for Ceme
- Page 233 and 234:
Estimated Estimated Estimated annua
- Page 235 and 236:
Potential emission Additional elect
- Page 237 and 238:
7.5 References for Section 7 1. NAC
- Page 239 and 240:
8. Sulfuric Acid Manufacturing Plan
- Page 241 and 242:
Estimated Potential emission Pollut
- Page 243 and 244:
8.2 Factor 2 - Time Necessary for C
- Page 245 and 246:
8.5 References for Section 8 1. WRA
- Page 247 and 248:
Table 9-1. Emissions from Lime Kiln
- Page 249 and 250:
kiln size and other factors. The lo
- Page 251 and 252:
Table 9-4. Estimated Energy and Non
- Page 253 and 254:
10. Oil Refineries Petroleum refine
- Page 255 and 256:
Baseline Estimated Potential emissi
- Page 257 and 258:
Source Type Control Technology Proc
- Page 259 and 260:
Potential Energy and non‐air poll
- Page 261 and 262:
10.5 References for Section 10 1. W
- Page 263 and 264:
Washington State Regional Haze Stat
- Page 265 and 266:
Baseline emissions (2000-2004) 2.3
- Page 267 and 268:
Hide Navigation Bar Figure 2-1. The
- Page 269 and 270:
• WRAP Regional Modeling Center (
- Page 271 and 272:
as calculated and reported by VIEWS
- Page 273 and 274:
3.0 DATA QUALITY ASSURANCE 3.1 OVER
- Page 275 and 276:
EPA requires monitoring programs to
- Page 277 and 278:
Preliminary Reasonable Progress - V
- Page 279 and 280:
ADB2. Dust Emissions from Pacific o
- Page 281 and 282:
For each of these model simulations
- Page 283 and 284:
Daily observed extinction at the Sa
- Page 285 and 286:
dominate the Worst 20 % days in 200
- Page 287 and 288:
4.0 DESCRIPTION OF WRAP ANALYSES EP
- Page 289 and 290:
Monitored Baseline to 2018 Baseline
- Page 291 and 292:
Figure 4-3. Example species glide s
- Page 293 and 294:
Figure 4-4. Example PSAT results fo
- Page 295 and 296:
4.5.3 Organic Aerosol Tracer The CM
- Page 297 and 298:
Appendix A Technical Analysis Forum
- Page 299 and 300:
The Interagency Monitoring of PROte
- Page 301 and 302:
The revised equation splits ammoniu
- Page 303 and 304:
Directly measured light scattering
- Page 305 and 306:
42 Final December 2010
- Page 307 and 308:
extinction species, and can still b
- Page 309 and 310:
Table 4 - EXAMPLE DATA TABLE - Unif
- Page 311 and 312:
• Flow rates were recalculated to
- Page 313 and 314:
Additional Data Substitutions INGA1
- Page 315 and 316:
OC (µg/m³) 10 8 6 4 2 0 r2 = 0.9
- Page 317 and 318:
KAIS1 X X YOSE1 -- -- 2 1 1 CA RAFA
- Page 319 and 320:
F igure 10. Daily o bserved extinct
- Page 321 and 322:
dominate the Worst 20 % days in 200
- Page 323 and 324:
Missing IMPROVE Data: To date, 2018
- Page 325 and 326:
Table 7. Mapping of Particulate RMC
- Page 327 and 328:
Haziness Index (Dec iv iews) 16 14
- Page 329 and 330:
Figure 19. Modeled reduction in ext
- Page 331 and 332:
Alternative Model Projection Techni
- Page 333 and 334:
Figure 22. Example PM extinction (M
- Page 335 and 336:
Place with explanatory text in Moni
- Page 337 and 338:
Place with explanatory text in Moni
- Page 339 and 340:
Washington State Regional Haze Stat
- Page 341 and 342:
FINAL 10/11/06 A streamlined and co
- Page 343 and 344:
FINAL 10/11/06 that pollutant will
- Page 345 and 346:
FINAL 10/11/06 in the multi-source
- Page 347 and 348:
Figure 1. CALMET Meteorological Dom
- Page 349 and 350:
FINAL 10/11/06 5) CALMET was run us
- Page 351 and 352:
FINAL 10/11/06 U.S. EPA - the EPA h
- Page 353 and 354:
FINAL 10/11/06 The U.S. EPA recomme
- Page 355 and 356:
FINAL 10/11/06 Table 1. Federal Man
- Page 357 and 358:
FINAL 10/11/06 Appendix B Natural V
- Page 359 and 360:
FINAL 10/11/06 Appendix C CALMET Pa
- Page 361 and 362:
FINAL 10/11/06 Recommended CALMET p
- Page 363 and 364:
FINAL 10/11/06 Appendix D CALPUFF P
- Page 365 and 366:
FINAL 10/11/06 Recommended CALPUFF
- Page 367 and 368:
FINAL 10/11/06 Recommended CALPUFF
- Page 369 and 370:
FINAL 10/11/06 Appendix E CALPOST P
- Page 371 and 372:
Use of 0.5-km Grid Spacing to Evalu
- Page 373 and 374:
model used for the input meteorolog
- Page 375 and 376:
Final December 2010 Figure I-1 Terr
- Page 377 and 378:
Final December 2010 Figure I-3 Clos
- Page 379 and 380:
Final December 2010 Figure I-5 Terr
- Page 381 and 382:
Final December 2010 Figure I-7 Date
- Page 383 and 384:
Washington State Regional Haze Stat
- Page 385 and 386:
Regional Haze BART Guidance Guideli
- Page 387 and 388:
Regional Haze BART Guidance The fol
- Page 389 and 390:
Regional Haze BART Guidance II. The
- Page 391 and 392:
Regional Haze BART Guidance technol
- Page 393 and 394:
Regional Haze BART Guidance Ecology
- Page 395 and 396:
Regional Haze BART Guidance While r
- Page 397 and 398:
Regional Haze BART Guidance What do
- Page 399 and 400:
Regional Haze BART Guidance Two key
- Page 401 and 402:
Regional Haze BART Guidance To dete
- Page 403 and 404:
Regional Haze BART Guidance ii. How
- Page 405 and 406:
Regional Haze BART Guidance Example
- Page 407 and 408:
Regional Haze BART Guidance for les
- Page 409 and 410:
Regional Haze BART Guidance energy
- Page 411 and 412:
Regional Haze BART Guidance We enco
- Page 413 and 414:
Regional Haze BART Guidance If the
- Page 415 and 416:
Regional Haze BART Guidance for the
- Page 417 and 418:
Regional Haze BART Guidance (5) Ene
- Page 419 and 420:
Regional Haze BART Guidance EPA rec
- Page 421 and 422:
Regional Haze BART Guidance plants.
- Page 423 and 424:
Regional Haze BART Guidance Specify
- Page 425 and 426:
Contents Overview of Appendix K Res
- Page 427 and 428:
Response to Comments A. General Com
- Page 429 and 430:
utility costs down by not increasin
- Page 431 and 432:
found BART for the TransAlta Centra
- Page 433 and 434:
• It simply must not be acceptabl
- Page 435 and 436:
assurance to TransAlta employees an
- Page 437 and 438:
Ecology concluded that a visibility
- Page 439 and 440:
of switching to a lower sulfur fuel
- Page 441 and 442:
controls on existing sources, Ecolo
- Page 443 and 444:
Ecology Response: It is Ecology’s
- Page 445 and 446:
evaluation of those combustion cont
- Page 447 and 448:
normal turnaround time for the CO b
- Page 449 and 450:
K. TransAlta Comment #37: The Centr
- Page 451 and 452:
EPA and the various new monitoring
- Page 453 and 454:
Please concern yourself with real p
- Page 455 and 456:
established a Fire Emissions Joint
- Page 457 and 458:
• I am a licensed physician resid
- Page 459 and 460:
Ecology Response: Ecology conducted
- Page 461 and 462:
Final December 2010 Joe McHugh 6 Ka
- Page 463 and 464:
K - 39 Final December 2010
- Page 465 and 466:
K - 41 Final December 2010
- Page 467 and 468:
K - 43 Final December 2010
- Page 469 and 470:
October 6, 2010 Doug Schneider Depa
- Page 471 and 472:
K - 47 Final December 2010
- Page 473 and 474:
K - 49 Final December 2010
- Page 475 and 476:
K - 51 Final December 2010
- Page 477 and 478:
K - 53 Final December 2010
- Page 479 and 480:
Note: Multiple copies of this form
- Page 481 and 482:
Blain, Lindsay (ECY) From: Earthjus
- Page 483 and 484:
Blain, Lindsay (ECY) From: Sierra C
- Page 485 and 486:
Blain, Lindsay (ECY) From: Sierra C
- Page 487 and 488:
Blain, Lindsay (ECY) From: Sierra C
- Page 489 and 490:
(206) 527‐9302 2 K - 65 Final Dec
- Page 491 and 492:
Sincerely, Dave Nichols PO Box 56 S
- Page 493 and 494:
Blain, Lindsay (ECY) From: Sierra C
- Page 495 and 496:
Blain, Lindsay (ECY) From: Sierra C
- Page 497 and 498:
Blain, Lindsay (ECY) From: Sierra C
- Page 499 and 500:
Blain, Lindsay (ECY) From: Earthjus
- Page 501 and 502:
Blain, Lindsay (ECY) From: Sierra C
- Page 503 and 504:
Blain, Lindsay (ECY) From: Sierra C
- Page 505 and 506:
Please protect the our treasured wi
- Page 507 and 508:
Fran Post 254 Woodland Ave Port Tow
- Page 509 and 510:
Blain, Lindsay (ECY) From: Sierra C
- Page 511 and 512:
Blain, Lindsay (ECY) From: Sierra C
- Page 513 and 514:
Blain, Lindsay (ECY) From: Sierra C
- Page 515 and 516:
Blain, Lindsay (ECY) From: Sierra C
- Page 517 and 518:
Blain, Lindsay (ECY) From: Sierra C
- Page 519 and 520:
Blain, Lindsay (ECY) From: Earthjus
- Page 521 and 522:
Blain, Lindsay (ECY) From: Sierra C
- Page 523 and 524:
Blain, Lindsay (ECY) From: Sierra C
- Page 525 and 526:
Blain, Lindsay (ECY) From: Sierra C
- Page 527 and 528:
Blain, Lindsay (ECY) From: Sierra C
- Page 529 and 530:
Blain, Lindsay (ECY) From: Sierra C
- Page 531 and 532:
Blain, Lindsay (ECY) From: Sierra C
- Page 533 and 534:
Blain, Lindsay (ECY) From: Sierra C
- Page 535 and 536:
Blain, Lindsay (ECY) From: Sierra C
- Page 537 and 538:
Blain, Lindsay (ECY) From: Sierra C
- Page 539 and 540:
16226 N Sands Rd Mead, WA 99021‐7
- Page 541 and 542:
Seattle, WA 98102‐5959 2 K - 117
- Page 543 and 544:
(360) 321‐4883 2 K - 119 Final De
- Page 545 and 546:
Thanks for listening. Sincerely, Ed
- Page 547 and 548:
Sincerely, Jody Fox 310 Bellevue Av
- Page 549 and 550:
4208 Glasgow Way Anacortes, WA 9822
- Page 551 and 552:
(206) 363‐6347 2 K - 127 Final De
- Page 553 and 554:
2551 Captains Ct Ferndale, WA 98248
- Page 555 and 556:
Sincerely, Robert Moore 14727 39th
- Page 557 and 558:
Dan & Pat Montague 647 73rd Ave NE
- Page 559 and 560:
David Yao 1538 N 128th St Seattle,
- Page 561 and 562:
Blain, Lindsay (ECY) From: Sierra C
- Page 563 and 564:
Blain, Lindsay (ECY) From: Sierra C
- Page 565 and 566:
100 years or more. Now there are mo
- Page 567 and 568:
Sincerely, James Rosenthal PO Box 6
- Page 569 and 570:
2 K - 145 Final December 2010
- Page 571 and 572:
Blain, Lindsay (ECY) From: Sierra C
- Page 573 and 574:
Blain, Lindsay (ECY) From: Sierra C
- Page 575 and 576:
Blain, Lindsay (ECY) From: Sierra C
- Page 577 and 578:
Blain, Lindsay (ECY) From: Sierra C
- Page 579 and 580:
Blain, Lindsay (ECY) From: Earthjus
- Page 581 and 582:
2 K - 157 Final December 2010
- Page 583 and 584:
2 K - 159 Final December 2010
- Page 585 and 586:
Nitrogen oxide pollution is also a
- Page 587 and 588:
Sincerely, Eileen Lamar 832 Lacey,
- Page 589 and 590:
Blain, Lindsay (ECY) From: Sierra C
- Page 591 and 592:
Blain, Lindsay (ECY) From: Sierra C
- Page 593 and 594:
Blain, Lindsay (ECY) From: Sierra C
- Page 595 and 596:
energy alternatives, stop killing t
- Page 597 and 598:
Blain, Lindsay (ECY) From: Earthjus
- Page 599 and 600:
2 K - 175 Final December 2010
- Page 601 and 602:
Blain, Lindsay (ECY) From: Earthjus
- Page 603 and 604:
Blain, Lindsay (ECY) From: Earthjus
- Page 605 and 606:
Sincerely, Mrs. Kay Ellison 4303 NE
- Page 607 and 608:
Ms. Cynthia Wilson 101 Maple Dr Por
- Page 609 and 610:
13 Village Dr Apt 102 Saugerties, N
- Page 611 and 612:
Janice Holkup 1147 N 93rd St Seattl
- Page 613 and 614:
Blain, Lindsay (ECY) From: Earthjus
- Page 615 and 616:
Blain, Lindsay (ECY) From: Earthjus
- Page 617 and 618:
Blain, Lindsay (ECY) From: Earthjus
- Page 619 and 620:
where wood and coal smoke is pumped
- Page 621 and 622:
percent or greater. Sincerely, Mr.
- Page 623 and 624:
where wood and coal smoke is pumped
- Page 625 and 626:
have emphysema. Not one of us smoke
- Page 627 and 628:
Blain, Lindsay (ECY) From: Earthjus
- Page 629 and 630:
Blain, Lindsay (ECY) From: Earthjus
- Page 631 and 632:
Blain, Lindsay (ECY) From: Earthjus
- Page 633 and 634:
Blain, Lindsay (ECY) From: Earthjus
- Page 635 and 636:
Blain, Lindsay (ECY) From: Earthjus
- Page 637 and 638:
Blain, Lindsay (ECY) From: Earthjus
- Page 639 and 640:
Blain, Lindsay (ECY) From: Earthjus
- Page 641 and 642:
Blain, Lindsay (ECY) From: Earthjus
- Page 643 and 644:
Blain, Lindsay (ECY) From: Earthjus
- Page 645 and 646:
Ms. Yovonne Autrey‐Schell 360 Duc
- Page 647 and 648:
Unit 2B Bainbridge Island, WA 98110
- Page 649 and 650:
Blain, Lindsay (ECY) From: Earthjus
- Page 651 and 652:
Blain, Lindsay (ECY) From: Earthjus
- Page 653 and 654:
Blain, Lindsay (ECY) From: Earthjus
- Page 655 and 656:
Blain, Lindsay (ECY) From: Earthjus
- Page 657 and 658:
Blain, Lindsay (ECY) From: Earthjus
- Page 659 and 660:
Blain, Lindsay (ECY) From: Earthjus
- Page 661 and 662:
Blain, Lindsay (ECY) From: Earthjus
- Page 663 and 664:
Blain, Lindsay (ECY) From: Earthjus
- Page 665 and 666:
Blain, Lindsay (ECY) From: Earthjus
- Page 667 and 668:
Blain, Lindsay (ECY) From: Earthjus
- Page 669 and 670:
Blain, Lindsay (ECY) From: Earthjus
- Page 671 and 672:
Blain, Lindsay (ECY) From: Earthjus
- Page 673 and 674:
Blain, Lindsay (ECY) From: Earthjus
- Page 675 and 676:
Blain, Lindsay (ECY) From: Earthjus
- Page 677 and 678:
Blain, Lindsay (ECY) From: Earthjus
- Page 679 and 680:
Blain, Lindsay (ECY) From: Earthjus
- Page 681 and 682:
Blain, Lindsay (ECY) From: Earthjus
- Page 683 and 684:
Blain, Lindsay (ECY) From: Sierra C
- Page 685 and 686:
Sincerely, Kathleen Mckeehen PO Box
- Page 687 and 688:
Blain, Lindsay (ECY) From: Sierra C
- Page 689 and 690:
Blain, Lindsay (ECY) From: Sierra C
- Page 691 and 692:
Valley, WA 99181‐9718 2 K - 267 F
- Page 693 and 694:
6204 N Morton St Spokane, WA 99208
- Page 695 and 696:
Gerald Myers 539 Cedar Ave S Renton
- Page 697 and 698:
Please protect the our treasured wi
- Page 699 and 700:
Marilyn Smith 1415 8th St Clarkston
- Page 701 and 702:
from harm by revising the Regional
- Page 703 and 704:
McCleary, WA 98557‐0328 2 K - 279
- Page 705 and 706:
Sincerely, Lyz Kurnitz‐Thurlow 55
- Page 707 and 708:
Sincerely, Mr. Edwin Crayton 218 2n
- Page 709 and 710:
Blain, Lindsay (ECY) From: Sierra C
- Page 711 and 712:
or greater. Sincerely, Ron Good PO
- Page 713 and 714:
increasingly fragile planet. Sincer
- Page 715 and 716:
Jerry Barr 22910 90th Ave W Unit C3
- Page 717 and 718:
Blain, Lindsay (ECY) From: Sierra C
- Page 719 and 720:
Ms. Janet Bautista 6225 64th Ave W
- Page 721 and 722:
Mr. Eugene Ayres Lake Forest Park,
- Page 723 and 724:
Doug Schneider Department of Ecolog
- Page 725 and 726:
Doug Schneider Department of Ecolog
- Page 727 and 728:
Doug Schneider Department of Ecolog
- Page 729 and 730:
Doug Schneider Department of Ecolog
- Page 731 and 732:
Doug Schneider Department of Ecolog
- Page 733 and 734:
Doug Schneider Department of Ecolog
- Page 735 and 736:
Doug Schneider Department of Ecolog
- Page 737 and 738:
Doug Schneider Department of Ecolog
- Page 739 and 740:
Doug Schneider Department of Ecolog
- Page 741 and 742:
Doug Schneider Department of Ecolog
- Page 743 and 744:
Doug Schneider Department of Ecolog
- Page 745 and 746:
Doug Schneider Department of Ecolog
- Page 747 and 748:
K - 323 Final December 2010
- Page 749 and 750:
Final December 2010 18 Wisconsin Po
- Page 751 and 752:
and 5. These emissions limits are a
- Page 753 and 754:
hard copy location (e.g., copyright
- Page 755 and 756:
I. Background F. Executive Order 13
- Page 757 and 758:
that “current scientific knowledg
- Page 759 and 760:
those provisions.” 40 CFR §49.3.
- Page 761 and 762:
visibility impairment at the Grand
- Page 763 and 764:
The Court of Appeals for the Tenth
- Page 765 and 766:
predicted impact of 0.5 dv or more
- Page 767 and 768:
Gunnison Wilderness Area (WA), Cany
- Page 769 and 770:
form nitric acid. In the atmosphere
- Page 771 and 772:
NOx in 2009, 3 was built roughly fo
- Page 773 and 774:
fuel-bound nitrogen and high temper
- Page 775 and 776:
Unit 3 0.39 0.23 0.39 0.32 Unit 4 0
- Page 777 and 778:
In our ANPRM, EPA questioned the ab
- Page 779 and 780:
A subsequent report prepared by APS
- Page 781 and 782:
estimates for each unit. All of the
- Page 783 and 784:
Table 2: EPA, NPS, and APS Cost Eff
- Page 785 and 786:
Based on an economic analysis of th
- Page 787 and 788:
EPA concludes that the energy and n
- Page 789 and 790:
compared. Thus, an increase in visu
- Page 791 and 792:
approach that is more consistent wi
- Page 793 and 794:
concentrations in the Four Corners
- Page 795 and 796:
each Class I area for each year, av
- Page 797 and 798:
determined to all have similar leve
- Page 799 and 800:
e the most likely choice for APS fo
- Page 801 and 802:
units built after 1978 and the PM l
- Page 803 and 804:
Kilometers (km) Delta dv Delta dv %
- Page 805 and 806:
III. EPA Proposed Action on Materia
- Page 807 and 808:
facilities usually were subject to
- Page 809 and 810:
search data sources; complete and r
- Page 811 and 812:
direct compliance costs on the Nava
- Page 813 and 814:
with tribal officials early in the
- Page 815 and 816:
disproportionate effect on children
- Page 817 and 818:
J. Executive Order 12898: Federal A
- Page 819 and 820:
identifies the control equipment an
- Page 821 and 822:
heat inputs, in millions of BTU, fo
- Page 823 and 824:
Note: Multiple copies of this form
- Page 825 and 826:
Blain, Lindsay (ECY) From: Site Adm
- Page 827 and 828:
Blain, Lindsay (ECY) From: Site Adm
- Page 829 and 830:
Blain, Lindsay (ECY) From: Site Adm
- Page 831 and 832:
Blain, Lindsay (ECY) From: Site Adm
- Page 833 and 834:
Blain, Lindsay (ECY) From: Site Adm
- Page 835 and 836:
Blain, Lindsay (ECY) From: Site Adm
- Page 837 and 838:
Blain, Lindsay (ECY) From: Site Adm
- Page 839 and 840:
Blain, Lindsay (ECY) From: Site Adm
- Page 841 and 842:
Blain, Lindsay (ECY) From: Site Adm
- Page 843 and 844:
Blain, Lindsay (ECY) From: Site Adm
- Page 845 and 846:
Blain, Lindsay (ECY) From: Site Adm
- Page 847 and 848:
Blain, Lindsay (ECY) From: Site Adm
- Page 849 and 850:
Blain, Lindsay (ECY) From: Site Adm
- Page 851 and 852:
Blain, Lindsay (ECY) From: Site Adm
- Page 853 and 854:
Blain, Lindsay (ECY) From: Site Adm
- Page 855 and 856:
Blain, Lindsay (ECY) From: Site Adm
- Page 857 and 858:
Blain, Lindsay (ECY) From: Site Adm
- Page 859 and 860:
Blain, Lindsay (ECY) From: Site Adm
- Page 861 and 862:
Blain, Lindsay (ECY) From: Site Adm
- Page 863 and 864:
Blain, Lindsay (ECY) From: Site Adm
- Page 865 and 866:
Blain, Lindsay (ECY) From: Site Adm
- Page 867 and 868:
Blain, Lindsay (ECY) From: Site Adm
- Page 869 and 870:
Blain, Lindsay (ECY) From: Site Adm
- Page 871 and 872:
Blain, Lindsay (ECY) From: Site Adm
- Page 873 and 874:
Blain, Lindsay (ECY) From: Site Adm
- Page 875 and 876:
Blain, Lindsay (ECY) From: Site Adm
- Page 877 and 878:
Blain, Lindsay (ECY) From: Site Adm
- Page 879 and 880:
Blain, Lindsay (ECY) From: Site Adm
- Page 881 and 882:
Blain, Lindsay (ECY) From: Site Adm
- Page 883 and 884:
Blain, Lindsay (ECY) From: Site Adm
- Page 885 and 886:
Blain, Lindsay (ECY) From: Site Adm
- Page 887 and 888:
Blain, Lindsay (ECY) From: Site Adm
- Page 889 and 890:
Blain, Lindsay (ECY) From: Site Adm
- Page 891 and 892:
Blain, Lindsay (ECY) From: Site Adm
- Page 893 and 894:
Blain, Lindsay (ECY) From: Site Adm
- Page 895 and 896:
Blain, Lindsay (ECY) From: Site Adm
- Page 897 and 898:
Blain, Lindsay (ECY) From: Site Adm
- Page 899 and 900:
Blain, Lindsay (ECY) From: Site Adm
- Page 901 and 902:
Blain, Lindsay (ECY) From: Site Adm
- Page 903 and 904:
Blain, Lindsay (ECY) From: Site Adm
- Page 905 and 906:
Blain, Lindsay (ECY) From: Site Adm
- Page 907 and 908:
Blain, Lindsay (ECY) From: Site Adm
- Page 909 and 910:
Blain, Lindsay (ECY) From: Site Adm
- Page 911 and 912:
Blain, Lindsay (ECY) From: Site Adm
- Page 913 and 914:
Blain, Lindsay (ECY) From: Site Adm
- Page 915 and 916:
Blain, Lindsay (ECY) From: Site Adm
- Page 917 and 918:
Blain, Lindsay (ECY) From: Site Adm
- Page 919 and 920:
Blain, Lindsay (ECY) From: Site Adm
- Page 921 and 922:
Blain, Lindsay (ECY) From: Site Adm
- Page 923 and 924:
Blain, Lindsay (ECY) From: Site Adm
- Page 925 and 926:
Blain, Lindsay (ECY) From: Site Adm
- Page 927 and 928:
Blain, Lindsay (ECY) From: Site Adm
- Page 929 and 930:
Blain, Lindsay (ECY) From: Site Adm
- Page 931 and 932:
Blain, Lindsay (ECY) From: Site Adm
- Page 933 and 934:
Blain, Lindsay (ECY) From: Site Adm
- Page 935 and 936:
Blain, Lindsay (ECY) From: Site Adm
- Page 937 and 938:
Blain, Lindsay (ECY) From: Site Adm
- Page 939 and 940:
Blain, Lindsay (ECY) From: Site Adm
- Page 941 and 942:
Blain, Lindsay (ECY) From: Site Adm
- Page 943 and 944:
Blain, Lindsay (ECY) From: Site Adm
- Page 945 and 946:
Blain, Lindsay (ECY) From: Site Adm
- Page 947 and 948:
Blain, Lindsay (ECY) From: Site Adm
- Page 949 and 950:
Blain, Lindsay (ECY) From: Site Adm
- Page 951 and 952:
Blain, Lindsay (ECY) From: Site Adm
- Page 953 and 954:
Blain, Lindsay (ECY) From: Site Adm
- Page 955 and 956:
Blain, Lindsay (ECY) From: Site Adm
- Page 957 and 958:
Blain, Lindsay (ECY) From: Site Adm
- Page 959 and 960:
Blain, Lindsay (ECY) From: Site Adm
- Page 961 and 962:
Blain, Lindsay (ECY) From: Site Adm
- Page 963 and 964:
Blain, Lindsay (ECY) From: Site Adm
- Page 965 and 966:
Blain, Lindsay (ECY) From: Site Adm
- Page 967 and 968:
Blain, Lindsay (ECY) From: Site Adm
- Page 969 and 970:
Blain, Lindsay (ECY) From: Site Adm
- Page 971 and 972:
Blain, Lindsay (ECY) From: Site Adm
- Page 973 and 974:
Blain, Lindsay (ECY) From: Site Adm
- Page 975 and 976:
Blain, Lindsay (ECY) From: Site Adm
- Page 977 and 978:
Blain, Lindsay (ECY) From: Site Adm
- Page 979 and 980:
Blain, Lindsay (ECY) From: Site Adm
- Page 981 and 982:
Blain, Lindsay (ECY) From: Site Adm
- Page 983 and 984:
Blain, Lindsay (ECY) From: Site Adm
- Page 985 and 986:
Blain, Lindsay (ECY) From: Site Adm
- Page 987 and 988:
Blain, Lindsay (ECY) From: Site Adm
- Page 989 and 990:
Blain, Lindsay (ECY) From: Site Adm
- Page 991 and 992:
Blain, Lindsay (ECY) From: Site Adm
- Page 993 and 994:
TransAlta would have on all twelve
- Page 995 and 996:
oxide emissions that would reduce p
- Page 997 and 998:
Technical Comments on the Public Re
- Page 999 and 1000:
problems related to specific circum
- Page 1001 and 1002:
Ecology also states that there is a
- Page 1003 and 1004:
applications will require significa
- Page 1005 and 1006:
higher resolution, perhaps 10 meter
- Page 1007 and 1008:
knowing whether or not the change i
- Page 1009 and 1010:
Respectfully, Dale Swedberg, Chair
- Page 1011 and 1012:
Appendix A Benefits of Fire velutin
- Page 1013 and 1014:
K - 589 Final December 2010
- Page 1015 and 1016:
K - 591 Final December 2010
- Page 1017 and 1018:
K - 593 Final December 2010
- Page 1019 and 1020:
K - 595 Final December 2010
- Page 1021 and 1022:
K - 597 Final December 2010
- Page 1023 and 1024:
K - 599 Final December 2010
- Page 1025 and 1026:
K - 601 Final December 2010
- Page 1027 and 1028:
K - 603 Final December 2010
- Page 1029 and 1030:
K - 605 Final December 2010
- Page 1031 and 1032:
K - 607 Final December 2010
- Page 1033 and 1034:
K - 609 Final December 2010
- Page 1035 and 1036:
K - 611 Final December 2010
- Page 1037 and 1038:
K - 613 Final December 2010
- Page 1039 and 1040:
K - 615 Final December 2010
- Page 1041 and 1042:
K - 617 Final December 2010
- Page 1043 and 1044:
K - 619 Final December 2010
- Page 1045 and 1046:
K - 621 Final December 2010
- Page 1047 and 1048:
K - 623 Final December 2010
- Page 1049 and 1050:
K - 625 Final December 2010
- Page 1051 and 1052:
K - 627 Final December 2010
- Page 1053 and 1054:
K - 629 Final December 2010
- Page 1055 and 1056:
K - 631 Final December 2010
- Page 1057 and 1058:
K - 633 Final December 2010
- Page 1059 and 1060:
K - 635 Final December 2010
- Page 1061 and 1062:
K - 637 Final December 2010
- Page 1063 and 1064:
K - 639 Final December 2010
- Page 1065 and 1066:
K - 641 Final December 2010
- Page 1067 and 1068:
K - 643 Final December 2010
- Page 1069 and 1070:
K - 645 Final December 2010
- Page 1071 and 1072:
K - 647 Final December 2010
- Page 1073 and 1074:
K - 649 Final December 2010
- Page 1075 and 1076:
K - 651 Final December 2010
- Page 1077 and 1078:
K - 653 Final December 2010
- Page 1079 and 1080:
K - 655 Final December 2010
- Page 1081 and 1082:
K - 657 Final December 2010
- Page 1083 and 1084:
K - 659 Final December 2010
- Page 1085 and 1086:
K - 661 Final December 2010
- Page 1087 and 1088:
K - 663 Final December 2010
- Page 1089 and 1090:
K - 665 Final December 2010
- Page 1091 and 1092:
K - 667 Final December 2010
- Page 1093 and 1094:
K - 669 Final December 2010
- Page 1095 and 1096:
K - 671 Final December 2010
- Page 1097 and 1098:
K - 673 Final December 2010
- Page 1099 and 1100:
K - 675 Final December 2010
- Page 1101 and 1102:
K - 677 Final December 2010
- Page 1103 and 1104:
K - 679 Final December 2010
- Page 1105 and 1106:
K - 681 Final December 2010
- Page 1107 and 1108:
Final December 2010 make tonight an
- Page 1109 and 1110:
Final December 2010 We generated an
- Page 1111 and 1112:
Final December 2010 existing system
- Page 1113 and 1114:
The National Park Service will be s
- Page 1115 and 1116:
We have members and leaders who are
- Page 1117 and 1118:
Once we decide to stop all the othe
- Page 1119 and 1120:
Jerry Thielen: Thank you. Is it Fin
- Page 1121 and 1122:
Final December 2010 I’m hearing i
- Page 1123 and 1124:
Jerry Thielen: You can take it out
- Page 1125 and 1126:
K - 701 Final December 2010
- Page 1127 and 1128:
K - 703 Final December 2010
- Page 1129 and 1130:
K - 705 Final December 2010
- Page 1131 and 1132:
K - 707 Final December 2010
- Page 1133 and 1134:
K - 709 Final December 2010
- Page 1135 and 1136:
K - 711 Final December 2010
- Page 1137 and 1138:
K - 713 Final December 2010
- Page 1139 and 1140:
K - 715 Final December 2010
- Page 1141 and 1142:
From: Thielen, Jerry (ECY) To: Clar
- Page 1143 and 1144:
Overview of Appendix L Contents Fin
- Page 1145 and 1146:
Table L-1 Issued Compliance Orders
- Page 1147 and 1148:
BART DETERMINATION SUPPORT DOCUMENT
- Page 1149 and 1150:
EXECUTIVE SUMMARY The Best Availabl
- Page 1151 and 1152:
Table ES-1. ECOLOGY’S DETERMINATI
- Page 1153 and 1154:
September 4, 2009 1. INTRODUCTION T
- Page 1155 and 1156:
September 4, 2009 Table 1-1 below l
- Page 1157 and 1158:
September 4, 2009 1.3 BART-Eligible
- Page 1159 and 1160:
September 4, 2009 The two BART-elig
- Page 1161 and 1162:
September 4, 2009 Final December 20
- Page 1163 and 1164:
September 4, 2009 BP proposed conti
- Page 1165 and 1166:
September 4, 2009 LNBs plus SCR: BP
- Page 1167 and 1168:
September 4, 2009 R-4 HC Reactor He
- Page 1169 and 1170:
September 4, 2009 Overview of Avail
- Page 1171 and 1172:
September 4, 2009 3. Proper design
- Page 1173 and 1174:
September 4, 2009 15-1451 1st Stage
- Page 1175 and 1176:
September 4, 2009 identify any addi
- Page 1177 and 1178:
September 4, 2009 LNBs in the TGU:
- Page 1179 and 1180:
September 4, 2009 effect on Class I
- Page 1181 and 1182:
September 4, 2009 The results prese
- Page 1183 and 1184:
September 4, 2009 Ecology recognize
- Page 1185 and 1186:
September 4, 2009 APPENDIX A. PRINC
- Page 1187 and 1188:
BART Support Document Page 35 of 35
- Page 1189 and 1190:
L - 48 Final December 2010
- Page 1191 and 1192:
L - 50 Final December 2010
- Page 1193 and 1194:
L - 52 Final December 2010
- Page 1195 and 1196:
L - 54 Final December 2010
- Page 1197 and 1198:
L - 56 Final December 2010
- Page 1199 and 1200:
L - 58 Final December 2010
- Page 1201 and 1202:
BART DETERMINATION SUPPORT DOCUMENT
- Page 1203 and 1204:
EXECUTIVE SUMMARY The Best Availabl
- Page 1205 and 1206:
March 3, 2009, Revised February 4,
- Page 1207 and 1208:
March 3, 2009, Revised February 4,
- Page 1209 and 1210:
March 3, 2009, Revised February 4,
- Page 1211 and 1212:
March 3, 2009, Revised February 4,
- Page 1213 and 1214:
March 3, 2009, Revised February 4,
- Page 1215 and 1216:
March 3, 2009, Revised February 4,
- Page 1217 and 1218:
March 3, 2009, Revised February 4,
- Page 1219 and 1220:
March 3, 2009, Revised February 4,
- Page 1221 and 1222:
March 3, 2009, Revised February 4,
- Page 1223 and 1224:
March 3, 2009, Revised February 4,
- Page 1225 and 1226:
BART Support Document Page 21 of 23
- Page 1227 and 1228:
BART Support Document Page 23 of 23
- Page 1229 and 1230:
L - 88 Final December 2010
- Page 1231 and 1232:
L - 90 Final December 2010
- Page 1233 and 1234:
L - 92 Final December 2010
- Page 1235 and 1236:
L - 94 Final December 2010
- Page 1237 and 1238:
L - 96 Final December 2010
- Page 1239 and 1240:
L - 98 Final December 2010
- Page 1241 and 1242:
L - 100 Final December 2010
- Page 1243 and 1244:
BART DETERMINATION SUPPORT DOCUMENT
- Page 1245 and 1246:
EXECUTIVE SUMMARY Final December 20
- Page 1247 and 1248:
July 22, 2009, Revised Feb. 22, 201
- Page 1249 and 1250:
July 22, 2009, Revised Feb. 22, 201
- Page 1251 and 1252:
July 22, 2009, Revised Feb. 22, 201
- Page 1253 and 1254:
July 22, 2009, Revised Feb. 22, 201
- Page 1255 and 1256:
July 22, 2009, Revised Feb. 22, 201
- Page 1257 and 1258:
July 22, 2009, Revised Feb. 22, 201
- Page 1259 and 1260:
July 22, 2009, Revised Feb. 22, 201
- Page 1261 and 1262:
July 22, 2009, Revised Feb. 22, 201
- Page 1263 and 1264:
July 22, 2009, Revised Feb. 22, 201
- Page 1265 and 1266:
July 22, 2009, Revised Feb. 22, 201
- Page 1267 and 1268:
July 22, 2009, Revised Feb. 22, 201
- Page 1269 and 1270:
July 22, 2009, Revised Feb. 22, 201
- Page 1271 and 1272:
July 22, 2009, Revised Feb. 22, 201
- Page 1273 and 1274:
July 22, 2009, Revised Feb. 22, 201
- Page 1275 and 1276:
July 22, 2009, Revised Feb. 22, 201
- Page 1277 and 1278:
July 22, 2009, Revised Feb. 22, 201
- Page 1279 and 1280:
July 22, 2009, Revised Feb. 22, 201
- Page 1281 and 1282:
July 22, 2009, Revised Feb. 22, 201
- Page 1283 and 1284:
July 22, 2009, Revised Feb. 22, 201
- Page 1285 and 1286:
July 22, 2009, Revised Feb. 22, 201
- Page 1287 and 1288:
July 22, 2009, Revised Feb. 22, 201
- Page 1289 and 1290:
July 22, 2009, Revised Feb. 22, 201
- Page 1291 and 1292:
July 22, 2009, Revised Feb. 22, 201
- Page 1293 and 1294:
BART Support Document Page 47 of 44
- Page 1295 and 1296:
L - 154 Final December 2010
- Page 1297 and 1298:
L - 156 Final December 2010
- Page 1299 and 1300:
L - 158 Final December 2010
- Page 1301 and 1302:
L - 160 Final December 2010
- Page 1303 and 1304:
L - 162 Final December 2010
- Page 1305 and 1306:
L - 164 Final December 2010
- Page 1307 and 1308:
L - 166 Final December 2010
- Page 1309 and 1310:
L - 168 Final December 2010
- Page 1311 and 1312:
TABLE OF CONTENTS Final December 20
- Page 1313 and 1314:
EXECUTIVE SUMMARY The Best Availabl
- Page 1315 and 1316:
August 24, 2009, Revised February 4
- Page 1317 and 1318:
August 24, 2009, Revised February 4
- Page 1319 and 1320: August 24, 2009, Revised February 4
- Page 1321 and 1322: August 24, 2009, Revised February 4
- Page 1323 and 1324: August 24, 2009, Revised February 4
- Page 1325 and 1326: August 24, 2009, Revised February 4
- Page 1327 and 1328: August 24, 2009, Revised February 4
- Page 1329 and 1330: August 24, 2009, Revised February 4
- Page 1331 and 1332: August 24, 2009, Revised February 4
- Page 1333 and 1334: August 24, 2009, Revised February 4
- Page 1335 and 1336: August 24, 2009, Revised February 4
- Page 1337 and 1338: August 24, 2009, Revised February 4
- Page 1339 and 1340: August 24, 2009, Revised February 4
- Page 1341 and 1342: August 24, 2009, Revised February 4
- Page 1343 and 1344: August 24, 2009, Revised February 4
- Page 1345 and 1346: August 24, 2009, Revised February 4
- Page 1347 and 1348: August 24, 2009, Revised February 4
- Page 1349 and 1350: August 24, 2009, Revised February 4
- Page 1351 and 1352: August 24, 2009, Revised February 4
- Page 1353 and 1354: August 24, 2009, Revised February 4
- Page 1355 and 1356: BART Support Document Page 42 of 42
- Page 1357 and 1358: L - 216 Final December 2010
- Page 1359 and 1360: L - 218 Final December 2010
- Page 1361 and 1362: L - 220 Final December 2010
- Page 1363 and 1364: L - 222 Final December 2010
- Page 1365 and 1366: TABLE OF CONTENTS Final December 20
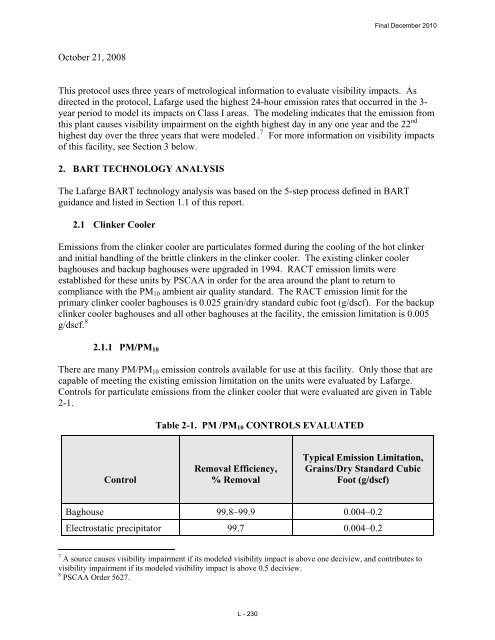
- Page 1367 and 1368: October 21, 2008 1. INTRODUCTION Th
- Page 1369: October 21, 2008 Final December 201
- Page 1373 and 1374: October 21, 2008 Final December 201
- Page 1375 and 1376: October 21, 2008 Wet lime scrubbing
- Page 1377 and 1378: October 21, 2008 kilns such as this
- Page 1379 and 1380: October 21, 2008 2.2.4 Proposed BAR
- Page 1381 and 1382: October 21, 2008 Class I Area Table
- Page 1383 and 1384: October 21, 2008 visibility impact,
- Page 1385 and 1386: October 21, 2008 4.4 Averaging Peri
- Page 1387 and 1388: Final December 2010 BART Support Do
- Page 1389 and 1390: October 21, 2008 APPENDIX C. ACRONY
- Page 1391 and 1392: L - 250 Final December 2010
- Page 1393 and 1394: L - 252 Final December 2010
- Page 1395 and 1396: L - 254 Final December 2010
- Page 1397 and 1398: L - 256 Final December 2010
- Page 1399 and 1400: Table of Contents Executive Summary
- Page 1401 and 1402: of an order which will result in th
- Page 1403 and 1404: BART Determination Document TransAl
- Page 1405 and 1406: BART Determination Document TransAl
- Page 1407 and 1408: BART Determination Document TransAl
- Page 1409 and 1410: BART Determination Document TransAl
- Page 1411 and 1412: BART Determination Document TransAl
- Page 1413 and 1414: BART Determination Document TransAl
- Page 1415 and 1416: BART Determination Document TransAl
- Page 1417 and 1418: BART Determination Document TransAl
- Page 1419 and 1420: BART Determination Document TransAl
- Page 1421 and 1422:
BART Determination Document TransAl
- Page 1423 and 1424:
BART Determination Document Page 22
- Page 1425 and 1426:
BART Determination Document TransAl
- Page 1427 and 1428:
BART Determination Document TransAl
- Page 1429 and 1430:
BART Determination Document TransAl
- Page 1431 and 1432:
BART Determination Document TransAl
- Page 1433 and 1434:
BART Determination Document TransAl
- Page 1435 and 1436:
BART Determination Document TransAl
- Page 1437 and 1438:
BART Determination Document TransAl
- Page 1439 and 1440:
BART Determination Document TransAl
- Page 1441 and 1442:
BART Determination Document TransAl
- Page 1443 and 1444:
BART Determination Document TransAl
- Page 1445 and 1446:
BART Determination Document TransAl
- Page 1447 and 1448:
BART Determination Document TransAl
- Page 1449 and 1450:
BART Determination Document TransAl
- Page 1451 and 1452:
BART Determination Document TransAl
- Page 1453 and 1454:
BART Determination Document TransAl
- Page 1455 and 1456:
BART Determination Document TransAl
- Page 1457 and 1458:
BART Determination Document TransAl
- Page 1459 and 1460:
BART Determination Document TransAl
- Page 1461 and 1462:
L - 320 Final December 2010
- Page 1463 and 1464:
L - 322 Final December 2010
- Page 1465 and 1466:
L - 324 Final December 2010
- Page 1467 and 1468:
L - 326 Final December 2010
- Page 1469 and 1470:
L - 328 Final December 2010
- Page 1471 and 1472:
L - 330 Final December 2010
- Page 1473 and 1474:
L - 332 Final December 2010
- Page 1475 and 1476:
BART Determination Document TransAl
- Page 1477 and 1478:
BART Determination Document TransAl
- Page 1479 and 1480:
BART Determination Document TransAl
- Page 1481 and 1482:
BART Determination Document TransAl
- Page 1483 and 1484:
BART Determination Document TransAl
- Page 1485 and 1486:
L - 344 Final December 2010
- Page 1487 and 1488:
L - 346 Final December 2010
- Page 1489 and 1490:
L - 348 Final December 2010
- Page 1491 and 1492:
BART DETERMINATION SUPPORT DOCUMENT
- Page 1493 and 1494:
EXECUTIVE SUMMARY The Best Availabl
- Page 1495 and 1496:
January 22, 2009 As allowed by the
- Page 1497 and 1498:
January 22, 2009 sulfate, sodium ca
- Page 1499 and 1500:
January 22, 2009 mechanisms exist,
- Page 1501 and 1502:
January 22, 2009 Table 2-3. SO2 CON
- Page 1503 and 1504:
January 22, 2009 of the plant out o
- Page 1505 and 1506:
January 22, 2009 At this time, ther
- Page 1507 and 1508:
January 22, 2009 preheaters, feed w
- Page 1509 and 1510:
January 22, 2009 To date, there are
- Page 1511 and 1512:
January 22, 2009 scrubber/forced ox
- Page 1513 and 1514:
January 22, 2009 3. VISIBILITY IMPA
- Page 1515 and 1516:
January 22, 2009 Table 4-1. ECOLOGY
- Page 1517 and 1518:
January 22, 2009 two such units ope
- Page 1519 and 1520:
January 22, 2009 APPENDIX A. PRINCI
- Page 1521 and 1522:
BART Support Document Page 28 of 28
- Page 1523 and 1524:
L - 382 Final December 2010
- Page 1525 and 1526:
L - 384 Final December 2010
- Page 1527 and 1528:
Air Quality Program Notice of Publi
- Page 1529 and 1530:
CORRECTION TO NOTICE PUBLISHED 9/9/
- Page 1531 and 1532:
Ecology’s Response to Comments on
- Page 1533 and 1534:
EPA Region 9 Federal Register Notic
- Page 1535 and 1536:
Final December 2010 scrubbing syste
- Page 1537 and 1538:
The BART process is not focused sol
- Page 1539 and 1540:
The visibility impacts at all Class
- Page 1541 and 1542:
ECOLOGY’S RESPONSE TO COMMENTS ON
- Page 1543 and 1544:
We also did not delve into the actu
- Page 1545 and 1546:
6. Due to the large visibility impa
- Page 1547 and 1548:
• Flex Fuels is not a NOX reducti
- Page 1549 and 1550:
distance is used to evenly distribu
- Page 1551 and 1552:
Step 5 in the EPA guidance document
- Page 1553 and 1554:
State Unit Colorado (cont.) Public
- Page 1555 and 1556:
State Unit Generating Station Unit
- Page 1557 and 1558:
For cost-effectiveness, we are rely
- Page 1559 and 1560:
5. SCR Costs evaluated on a 15-year
- Page 1561 and 1562:
Staff members with Ecology’s Air
- Page 1563 and 1564:
waiting for EPA to complete new rul
- Page 1565 and 1566:
Comments on TransAlta Coal-fired Po
- Page 1567 and 1568:
to be something the Plant already w
- Page 1569 and 1570:
various mines in the PRB with likel
- Page 1571 and 1572:
analysis of how much SCR catalyst w
- Page 1573 and 1574:
(ix) While cost is one factor in th
- Page 1575 and 1576:
opposed to SCR resulting in additio
- Page 1577 and 1578:
coal. It would also appear that Eco
- Page 1579 and 1580:
Via Electronic Mail Sarah Rees Wash
- Page 1581 and 1582:
Ms. Sarah Rees Department of Ecolog
- Page 1583 and 1584:
Ms. Sarah Rees Department of Ecolog
- Page 1585 and 1586:
Ms. Sarah Rees Department of Ecolog
- Page 1587 and 1588:
Ms. Sarah Rees Department of Ecolog
- Page 1589 and 1590:
Ms. Sarah Rees Department of Ecolog
- Page 1591 and 1592:
Ms. Sarah Rees Department of Ecolog
- Page 1593 and 1594:
Ms. Sarah Rees Department of Ecolog
- Page 1595 and 1596:
L - 454 Final December 2010
- Page 1597 and 1598:
L - 456 Final December 2010
- Page 1599 and 1600:
L - 458 Final December 2010
- Page 1601 and 1602:
TransAlta anticipates operating the
- Page 1603 and 1604:
annual basis. In estimating the ann
- Page 1605 and 1606:
The SO2 and PM cost analyses were c
- Page 1607 and 1608:
areas. Our compilation 19 of BART a
- Page 1609 and 1610:
United States Department of Agricul
- Page 1611 and 1612:
eductions in NOx. Even if NOx emiss
- Page 1613 and 1614:
BART Compliance Section of the Sett
- Page 1615 and 1616:
file:///Y|/Regional%20Haze%20SIP/Ju
- Page 1617 and 1618:
file:///Y|/Regional%20Haze%20SIP/Ju
- Page 1619 and 1620:
Jerry: We’re gonna get started in
- Page 1621 and 1622:
Final December 2010 the public comm
- Page 1623 and 1624:
Final December 2010 So what did we
- Page 1625 and 1626:
Final December 2010 So now I’m go
- Page 1627 and 1628:
Final December 2010 contained lower
- Page 1629 and 1630:
potentially different fuels that wo
- Page 1631 and 1632:
world would not directly - you know
- Page 1633 and 1634:
Sarah: EPA has seen our draft BART
- Page 1635 and 1636:
Final December 2010 dirtiest way to
- Page 1637 and 1638:
Final December 2010 We are also con
- Page 1639 and 1640:
The National Park Service’s desir
- Page 1641 and 1642:
So I’m very concerned about that.
- Page 1643 and 1644:
Brimmer: Okay. Jerry: Yeah, go ahea
- Page 1645 and 1646:
Final December 2010 I also want to
- Page 1647 and 1648:
Final December 2010 plan, coal comp
- Page 1649 and 1650:
Final December 2010 necessary docum
- Page 1651 and 1652:
L - 510 Final December 2010
- Page 1653 and 1654:
L - 512 Final December 2010
- Page 1655 and 1656:
L - 514 Final December 2010
- Page 1657 and 1658:
L - 516 Final December 2010
- Page 1659 and 1660:
L - 518 Final December 2010
- Page 1661 and 1662:
Question 1: CENTRALIA BART RESPONSE
- Page 1663 and 1664:
TABLE A Economic Analysis Summary f
- Page 1665 and 1666:
L - 524 Final December 2010
- Page 1667 and 1668:
L - 526 Final December 2010
- Page 1669 and 1670:
L - 528 Final December 2010
- Page 1671 and 1672:
L - 530 Final December 2010
- Page 1673 and 1674:
L - 532 Final December 2010
- Page 1675 and 1676:
L - 534 Final December 2010
- Page 1677 and 1678:
L - 536 Final December 2010
- Page 1679 and 1680:
L - 538 Final December 2010
- Page 1681 and 1682:
L - 540 Final December 2010
- Page 1683 and 1684:
Final December 2010 Additional Info
- Page 1685 and 1686:
CH2M Hill's Cost Component CH2M Hil
- Page 1687 and 1688:
CH2M Hill's Cost Component CONTROL
- Page 1689 and 1690:
Washington State Regional Haze SIP
- Page 1691 and 1692:
Table M-1 Crosswalk between Washing
- Page 1693 and 1694:
M-5 Final December 2010 Public Revi
- Page 1695 and 1696:
Final December 2010 Figure M-2 NOCA
- Page 1697 and 1698:
Final December 2010 Figure M-4 MORA
- Page 1699 and 1700:
M-11 Final December 2010 Public Rev
- Page 1701 and 1702:
M-13 Final December 2010 Public Rev
- Page 1703 and 1704:
THE MOST IMPAIRED DAYS, Winter (Q1
- Page 1705 and 1706:
Conclusion Final December 2010 IMPR