Attention! Your ePaper is waiting for publication!
By publishing your document, the content will be optimally indexed by Google via AI and sorted into the right category for over 500 million ePaper readers on YUMPU.
This will ensure high visibility and many readers!

Your ePaper is now published and live on YUMPU!
You can find your publication here:
Share your interactive ePaper on all platforms and on your website with our embed function

Appendix A - Washington State Department of Ecology
Appendix A - Washington State Department of Ecology
Appendix A - Washington State Department of Ecology
Create successful ePaper yourself
Turn your PDF publications into a flip-book with our unique Google optimized e-Paper software.
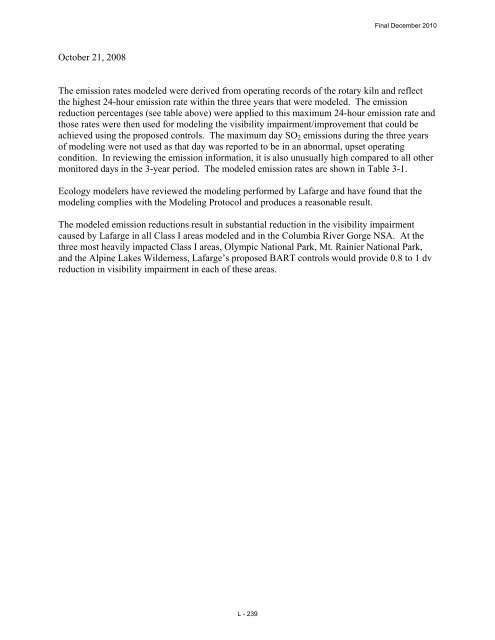
October 21, 2008<br />
Final December 2010<br />
The emission rates modeled were derived from operating records <strong>of</strong> the rotary kiln and reflect<br />
the highest 24-hour emission rate within the three years that were modeled. The emission<br />
reduction percentages (see table above) were applied to this maximum 24-hour emission rate and<br />
those rates were then used for modeling the visibility impairment/improvement that could be<br />
achieved using the proposed controls. The maximum day SO2 emissions during the three years<br />
<strong>of</strong> modeling were not used as that day was reported to be in an abnormal, upset operating<br />
condition. In reviewing the emission information, it is also unusually high compared to all other<br />
monitored days in the 3-year period. The modeled emission rates are shown in Table 3-1.<br />
<strong>Ecology</strong> modelers have reviewed the modeling performed by Lafarge and have found that the<br />
modeling complies with the Modeling Protocol and produces a reasonable result.<br />
The modeled emission reductions result in substantial reduction in the visibility impairment<br />
caused by Lafarge in all Class I areas modeled and in the Columbia River Gorge NSA. At the<br />
three most heavily impacted Class I areas, Olympic National Park, Mt. Rainier National Park,<br />
and the Alpine Lakes Wilderness, Lafarge’s proposed BART controls would provide 0.8 to 1 dv<br />
reduction in visibility impairment in each <strong>of</strong> these areas.<br />
L - 239
October 21, 2008 Final December 2010 The emission rates modeled were derived from operating records <strong>of</strong> the rotary kiln and reflect the highest 24-hour emission rate within the three years that were modeled. The emission reduction percentages (see table above) were applied to this maximum 24-hour emission rate and those rates were then used for modeling the visibility impairment/improvement that could be achieved using the proposed controls. The maximum day SO2 emissions during the three years <strong>of</strong> modeling were not used as that day was reported to be in an abnormal, upset operating condition. In reviewing the emission information, it is also unusually high compared to all other monitored days in the 3-year period. The modeled emission rates are shown in Table 3-1. <strong>Ecology</strong> modelers have reviewed the modeling performed by Lafarge and have found that the modeling complies with the Modeling Protocol and produces a reasonable result. The modeled emission reductions result in substantial reduction in the visibility impairment caused by Lafarge in all Class I areas modeled and in the Columbia River Gorge NSA. At the three most heavily impacted Class I areas, Olympic National Park, Mt. Rainier National Park, and the Alpine Lakes Wilderness, Lafarge’s proposed BART controls would provide 0.8 to 1 dv reduction in visibility impairment in each <strong>of</strong> these areas. L - 239
October 21, 2008 Class I Area Table 3-1. THREE YEAR DELTA DECIVIEW RANKING SUMMARY Visibility Criterion Baseline Emissions Control Scenario 1: SNCR & DAA Control Scenario 2: SNCR & Wet Scrubbing Alpine Lakes Wilderness Max delta deciview 4.93 3.342 2.779 Max 98% value (8th high) 2.07 1.335 1.232 3-yrs Combined 98% value (22nd high) 2.06 1.318 1.182 Glacier Peak Wilderness Max delta deciview 3.34 2.234 1.754 Max 98% value (8th high) 1.62 1.05 0.866 3-yrs Combined 98% value (22nd high) 1.43 0.901 0.769 Goat Rocks Wilderness Max delta deciview 1.56 0.979 0.859 Max 98% value (8th high) 0.92 0.581 0.457 3-yrs Combined 98% value (22nd high) 0.85 0.529 0.448 Mt. Adams Wilderness Max delta deciview 1.49 0.934 0.812 Max 98% value (8th high) 0.78 0.491 0.389 3-yrs Combined 98% value (22nd high) 0.76 0.48 0.389 Mt. Hood Wilderness Max delta deciview 1.72 1.097 0.874 Max 98% value (8th high) 0.65 0.412 0.339 3-yrs Combined 98% value (22nd high) 0.62 0.383 0.307 Mt. Rainier National Park Max delta deciview 4.47 2.98 2.631 Max 98% value (8th high) 2.04 1.261 1.092 3-yrs Combined 98% value (22nd high) 1.78 1.131 0.959 North Cascades National Park Max delta deciview 2.76 1.8 1.577 Max 98% value (8th high) 1.48 0.947 0.754 3-yrs Combined 98% value (22nd high) 1.27 0.798 0.693 Olympic National Park Max delta deciview 6.99 4.893 4.25 Max 98% value (8th high) 3.16 2.072 1.81 3-yrs Combined 98% value (22nd high) 2.96 1.937 1.678 Pasayten Wilderness Max delta deciview 1.37 0.876 0.736 Max 98% value (8th high) 0.82 0.513 0.429 Class II area modeled per the Modeling Protocol Columbia River Gorge National 3-yrs Combined 98% value (22nd high) 0.72 0.461 0.393 Scenic Area Max delta deciview 1.41 0.881 0.758 Max 98% value (8th high) 0.59 0.371 0.336 3-yrs Combined 98% value (22nd high) 0.51 0.316 0.265 Modeled Rates (lb/hr) Modeled Rates (ton/day) Final December 2010 NOX --> 1595 957 957 SO2 --> 479 359 48 NOX --> 19.1 11.5 11.5 SO2 --> 5.7 4.3 0.6 The 8 th day in any year or the 22 nd day over the 2-year period is the 98 th percentile days. L - 240
- Page 1 and 2:
Washington State Regional Haze Stat
- Page 3 and 4:
co-chaired by a state and a tribal
- Page 5 and 6:
Membership Members Air program dire
- Page 7 and 8:
Sample Contribution Matrix for Supp
- Page 9 and 10:
� DRAFT 308 Regional Haze SIP/TIP
- Page 11 and 12:
2002 Events: 2001 Events: 2000 Even
- Page 13 and 14:
2001 Events: 2000 Events: 1999 Even
- Page 15 and 16:
2000 Events: 11/09/00 IOC Meeting A
- Page 17 and 18:
2003 Events: 2002 Events: 2001 Even
- Page 19 and 20:
03/15/01 Forum Meeting Summary, Sac
- Page 21 and 22:
2003 Events: 2002 Events: o Recent
- Page 23 and 24:
actual emissions, and forecasts the
- Page 25 and 26:
2001 Events: 09/27/01 Emissions For
- Page 27 and 28:
2002 Events: 12/10/03 FEJF Meeting,
- Page 29 and 30:
2000 Events: 06/07/00 Mobile Source
- Page 31 and 32:
o Status of WRAP comments on BART r
- Page 33 and 34:
Meetings 2007 Events: 2006 Events:
- Page 35 and 36:
Washington State Regional Haze Stat
- Page 37 and 38:
Section B-1 Overview of Appendix B
- Page 39 and 40:
B-5 Final December 2010
- Page 41 and 42:
Final December 2010 Section B-3 Eco
- Page 43 and 44:
Final December 2010 and Organic Car
- Page 45 and 46:
Final December 2010 Response: Ecolo
- Page 47 and 48:
B-13 Final December 2010
- Page 49 and 50:
B-15 Final December 2010
- Page 51 and 52:
B-17 Final December 2010
- Page 53 and 54:
B-19 Final December 2010
- Page 55 and 56:
B-21 Final December 2010
- Page 57 and 58:
Section B-5 Ecology’s Summary of
- Page 59 and 60:
Final December 2010 While Ecology n
- Page 61 and 62:
improve very slowly. Consider the p
- Page 63 and 64:
United States Department of Agricul
- Page 65 and 66:
Mr. Doug Schneider Reasonable Progr
- Page 67 and 68:
Mr. Doug Schneider We also encourag
- Page 69 and 70:
Mr. Doug Schneider pollution of the
- Page 71 and 72:
Clint: Herman Wong/R10/USEPA/US 07/
- Page 73 and 74:
Wilson.Rob@epamail.epa.gov 06/08/20
- Page 75 and 76:
B-41 Final December 2010
- Page 77 and 78:
Washington State Regional Haze Stat
- Page 79 and 80:
Inversions/Trapping Temperature inv
- Page 81 and 82:
each to 1,500 m or higher which cou
- Page 83 and 84:
Inversions/Trapping The PASA1 site
- Page 85 and 86:
WRAP IMPROVE Data Substitutions 04/
- Page 87 and 88:
Additional Data Substitutions This
- Page 89 and 90:
2. Donor Site Substitutions In the
- Page 91 and 92:
2. Data Completeness Following Subs
- Page 93 and 94:
Results for Washington Sites The ch
- Page 95 and 96:
Extinction (Mm -1 ) Extinction (Mm
- Page 97 and 98:
OC (µg/m³) OC (µg/m³) 10 8 6 4
- Page 99 and 100:
AmmSO 4 (µg/m³) AmmSO 4 (µg/m³)
- Page 101 and 102:
OC (µg/m³) OC (µg/m³) 5 4 3 2 1
- Page 103 and 104:
Soil (µg/m³) Soil (µg/m³) 5 4 3
- Page 105 and 106:
SS (µg/m³) SS (µg/m³) 5 4 3 2 1
- Page 107 and 108:
Overview This appendix consists of
- Page 109 and 110:
Class I Area Visibility Summary: Ol
- Page 111 and 112:
Class I Area Visibility Summary: Gl
- Page 113 and 114:
Class I Area Visibility Summary: Al
- Page 115 and 116:
Class I Area Visibility Summary: Mo
- Page 117 and 118:
Class I Area Visibility Summary: Go
- Page 119 and 120:
Class I Area Visibility Summary: Pa
- Page 121 and 122:
period used as baseline data for th
- Page 123 and 124:
Washington State Regional Haze Stat
- Page 125 and 126:
Class I Area Summary Tables - Olymp
- Page 127 and 128:
Class I Area Summary Tables - North
- Page 129 and 130:
Class I Area Summary Tables - Alpin
- Page 131 and 132:
Class I Area Summary Tables - Mount
- Page 133 and 134:
Class I Area Summary Tables - Goat
- Page 135 and 136:
Class I Area Summary Tables - Pasay
- Page 137 and 138:
NOCA1 Revised 2018 Visibility Proje
- Page 139 and 140:
and annual average mass and extinct
- Page 141 and 142:
Overview Ecology developed a set of
- Page 143 and 144:
Table 1 Washington Source Category
- Page 145 and 146:
Final December 2010 Major Category
- Page 147 and 148:
Final December 2010 Major Category
- Page 149 and 150:
Table 5 Specific Industries and Emi
- Page 151 and 152:
at the Alcoa Wenatchee Works facili
- Page 153 and 154:
expansion of sulfur recovery system
- Page 155 and 156:
3. Petroleum Industry Catalytic Cra
- Page 157 and 158:
All emission controls systems avail
- Page 159 and 160:
Table 8 Summary of Emission Control
- Page 161 and 162:
It will take 1-2 years to complete
- Page 163 and 164:
with the lime/limestone in water dr
- Page 165 and 166:
Based on the above, it is Ecology
- Page 167 and 168:
Conclusions from the Four-Factor an
- Page 169 and 170:
Scope of Document This document pro
- Page 171 and 172:
10. Oil Refineries ................
- Page 173 and 174:
STAPPA State and Territorial Air Po
- Page 175 and 176:
We have identified control measures
- Page 177 and 178:
The U.S. EPA’s Guidance for Setti
- Page 179 and 180:
The ages of major pieces of equipme
- Page 181 and 182:
Table 3-1. Emissions from Reciproca
- Page 183 and 184:
Baseline Potential emission emissio
- Page 185 and 186:
3.2 Factor 2 - Time Necessary for C
- Page 187 and 188:
3.4 Factor 4 - Remaining Equipment
- Page 189 and 190:
4. Oil and Gas Exploration and Prod
- Page 191 and 192:
Table 4-1. Emissions from Oil and G
- Page 193 and 194:
Turbines Table 4-2. Control Options
- Page 195 and 196:
educe NOX emissions from process he
- Page 197 and 198:
Table 4-3. Estimated Costs of Contr
- Page 199 and 200:
Table 4-4. Estimated Energy and Non
- Page 201 and 202:
4.4 Factor 4 - Remaining Equipment
- Page 203 and 204:
20. EPA (2002), EPA Air Pollution C
- Page 205 and 206:
Emission source AK CA CO MT ND NM N
- Page 207 and 208:
turbines. 3,4,5,6,7,8 Reciprocating
- Page 209 and 210:
Estimated Estimated Estimated annua
- Page 211 and 212:
Sulfur recovery units require elect
- Page 213 and 214:
16 . Ghoreishi, Farrokh (2007), Tim
- Page 215 and 216:
industrial boiler control option st
- Page 217 and 218:
Source Type Coal-fired Oil-fired Ta
- Page 219 and 220:
Source Type Coal-fired (Pre PSD Reg
- Page 221 and 222:
6.1 Factor 1 - Costs Table 6-3 prov
- Page 223 and 224:
Table 6-4. Estimated Energy and Non
- Page 225 and 226:
6.5 References for Section 6 1. Ene
- Page 227 and 228:
urners reduce flame turbulence, del
- Page 229 and 230:
Table 7-1. Emissions from Cement Ki
- Page 231 and 232:
Table 7-2. Control Options for Ceme
- Page 233 and 234:
Estimated Estimated Estimated annua
- Page 235 and 236:
Potential emission Additional elect
- Page 237 and 238:
7.5 References for Section 7 1. NAC
- Page 239 and 240:
8. Sulfuric Acid Manufacturing Plan
- Page 241 and 242:
Estimated Potential emission Pollut
- Page 243 and 244:
8.2 Factor 2 - Time Necessary for C
- Page 245 and 246:
8.5 References for Section 8 1. WRA
- Page 247 and 248:
Table 9-1. Emissions from Lime Kiln
- Page 249 and 250:
kiln size and other factors. The lo
- Page 251 and 252:
Table 9-4. Estimated Energy and Non
- Page 253 and 254:
10. Oil Refineries Petroleum refine
- Page 255 and 256:
Baseline Estimated Potential emissi
- Page 257 and 258:
Source Type Control Technology Proc
- Page 259 and 260:
Potential Energy and non‐air poll
- Page 261 and 262:
10.5 References for Section 10 1. W
- Page 263 and 264:
Washington State Regional Haze Stat
- Page 265 and 266:
Baseline emissions (2000-2004) 2.3
- Page 267 and 268:
Hide Navigation Bar Figure 2-1. The
- Page 269 and 270:
• WRAP Regional Modeling Center (
- Page 271 and 272:
as calculated and reported by VIEWS
- Page 273 and 274:
3.0 DATA QUALITY ASSURANCE 3.1 OVER
- Page 275 and 276:
EPA requires monitoring programs to
- Page 277 and 278:
Preliminary Reasonable Progress - V
- Page 279 and 280:
ADB2. Dust Emissions from Pacific o
- Page 281 and 282:
For each of these model simulations
- Page 283 and 284:
Daily observed extinction at the Sa
- Page 285 and 286:
dominate the Worst 20 % days in 200
- Page 287 and 288:
4.0 DESCRIPTION OF WRAP ANALYSES EP
- Page 289 and 290:
Monitored Baseline to 2018 Baseline
- Page 291 and 292:
Figure 4-3. Example species glide s
- Page 293 and 294:
Figure 4-4. Example PSAT results fo
- Page 295 and 296:
4.5.3 Organic Aerosol Tracer The CM
- Page 297 and 298:
Appendix A Technical Analysis Forum
- Page 299 and 300:
The Interagency Monitoring of PROte
- Page 301 and 302:
The revised equation splits ammoniu
- Page 303 and 304:
Directly measured light scattering
- Page 305 and 306:
42 Final December 2010
- Page 307 and 308:
extinction species, and can still b
- Page 309 and 310:
Table 4 - EXAMPLE DATA TABLE - Unif
- Page 311 and 312:
• Flow rates were recalculated to
- Page 313 and 314:
Additional Data Substitutions INGA1
- Page 315 and 316:
OC (µg/m³) 10 8 6 4 2 0 r2 = 0.9
- Page 317 and 318:
KAIS1 X X YOSE1 -- -- 2 1 1 CA RAFA
- Page 319 and 320:
F igure 10. Daily o bserved extinct
- Page 321 and 322:
dominate the Worst 20 % days in 200
- Page 323 and 324:
Missing IMPROVE Data: To date, 2018
- Page 325 and 326:
Table 7. Mapping of Particulate RMC
- Page 327 and 328:
Haziness Index (Dec iv iews) 16 14
- Page 329 and 330:
Figure 19. Modeled reduction in ext
- Page 331 and 332:
Alternative Model Projection Techni
- Page 333 and 334:
Figure 22. Example PM extinction (M
- Page 335 and 336:
Place with explanatory text in Moni
- Page 337 and 338:
Place with explanatory text in Moni
- Page 339 and 340:
Washington State Regional Haze Stat
- Page 341 and 342:
FINAL 10/11/06 A streamlined and co
- Page 343 and 344:
FINAL 10/11/06 that pollutant will
- Page 345 and 346:
FINAL 10/11/06 in the multi-source
- Page 347 and 348:
Figure 1. CALMET Meteorological Dom
- Page 349 and 350:
FINAL 10/11/06 5) CALMET was run us
- Page 351 and 352:
FINAL 10/11/06 U.S. EPA - the EPA h
- Page 353 and 354:
FINAL 10/11/06 The U.S. EPA recomme
- Page 355 and 356:
FINAL 10/11/06 Table 1. Federal Man
- Page 357 and 358:
FINAL 10/11/06 Appendix B Natural V
- Page 359 and 360:
FINAL 10/11/06 Appendix C CALMET Pa
- Page 361 and 362:
FINAL 10/11/06 Recommended CALMET p
- Page 363 and 364:
FINAL 10/11/06 Appendix D CALPUFF P
- Page 365 and 366:
FINAL 10/11/06 Recommended CALPUFF
- Page 367 and 368:
FINAL 10/11/06 Recommended CALPUFF
- Page 369 and 370:
FINAL 10/11/06 Appendix E CALPOST P
- Page 371 and 372:
Use of 0.5-km Grid Spacing to Evalu
- Page 373 and 374:
model used for the input meteorolog
- Page 375 and 376:
Final December 2010 Figure I-1 Terr
- Page 377 and 378:
Final December 2010 Figure I-3 Clos
- Page 379 and 380:
Final December 2010 Figure I-5 Terr
- Page 381 and 382:
Final December 2010 Figure I-7 Date
- Page 383 and 384:
Washington State Regional Haze Stat
- Page 385 and 386:
Regional Haze BART Guidance Guideli
- Page 387 and 388:
Regional Haze BART Guidance The fol
- Page 389 and 390:
Regional Haze BART Guidance II. The
- Page 391 and 392:
Regional Haze BART Guidance technol
- Page 393 and 394:
Regional Haze BART Guidance Ecology
- Page 395 and 396:
Regional Haze BART Guidance While r
- Page 397 and 398:
Regional Haze BART Guidance What do
- Page 399 and 400:
Regional Haze BART Guidance Two key
- Page 401 and 402:
Regional Haze BART Guidance To dete
- Page 403 and 404:
Regional Haze BART Guidance ii. How
- Page 405 and 406:
Regional Haze BART Guidance Example
- Page 407 and 408:
Regional Haze BART Guidance for les
- Page 409 and 410:
Regional Haze BART Guidance energy
- Page 411 and 412:
Regional Haze BART Guidance We enco
- Page 413 and 414:
Regional Haze BART Guidance If the
- Page 415 and 416:
Regional Haze BART Guidance for the
- Page 417 and 418:
Regional Haze BART Guidance (5) Ene
- Page 419 and 420:
Regional Haze BART Guidance EPA rec
- Page 421 and 422:
Regional Haze BART Guidance plants.
- Page 423 and 424:
Regional Haze BART Guidance Specify
- Page 425 and 426:
Contents Overview of Appendix K Res
- Page 427 and 428:
Response to Comments A. General Com
- Page 429 and 430:
utility costs down by not increasin
- Page 431 and 432:
found BART for the TransAlta Centra
- Page 433 and 434:
• It simply must not be acceptabl
- Page 435 and 436:
assurance to TransAlta employees an
- Page 437 and 438:
Ecology concluded that a visibility
- Page 439 and 440:
of switching to a lower sulfur fuel
- Page 441 and 442:
controls on existing sources, Ecolo
- Page 443 and 444:
Ecology Response: It is Ecology’s
- Page 445 and 446:
evaluation of those combustion cont
- Page 447 and 448:
normal turnaround time for the CO b
- Page 449 and 450:
K. TransAlta Comment #37: The Centr
- Page 451 and 452:
EPA and the various new monitoring
- Page 453 and 454:
Please concern yourself with real p
- Page 455 and 456:
established a Fire Emissions Joint
- Page 457 and 458:
• I am a licensed physician resid
- Page 459 and 460:
Ecology Response: Ecology conducted
- Page 461 and 462:
Final December 2010 Joe McHugh 6 Ka
- Page 463 and 464:
K - 39 Final December 2010
- Page 465 and 466:
K - 41 Final December 2010
- Page 467 and 468:
K - 43 Final December 2010
- Page 469 and 470:
October 6, 2010 Doug Schneider Depa
- Page 471 and 472:
K - 47 Final December 2010
- Page 473 and 474:
K - 49 Final December 2010
- Page 475 and 476:
K - 51 Final December 2010
- Page 477 and 478:
K - 53 Final December 2010
- Page 479 and 480:
Note: Multiple copies of this form
- Page 481 and 482:
Blain, Lindsay (ECY) From: Earthjus
- Page 483 and 484:
Blain, Lindsay (ECY) From: Sierra C
- Page 485 and 486:
Blain, Lindsay (ECY) From: Sierra C
- Page 487 and 488:
Blain, Lindsay (ECY) From: Sierra C
- Page 489 and 490:
(206) 527‐9302 2 K - 65 Final Dec
- Page 491 and 492:
Sincerely, Dave Nichols PO Box 56 S
- Page 493 and 494:
Blain, Lindsay (ECY) From: Sierra C
- Page 495 and 496:
Blain, Lindsay (ECY) From: Sierra C
- Page 497 and 498:
Blain, Lindsay (ECY) From: Sierra C
- Page 499 and 500:
Blain, Lindsay (ECY) From: Earthjus
- Page 501 and 502:
Blain, Lindsay (ECY) From: Sierra C
- Page 503 and 504:
Blain, Lindsay (ECY) From: Sierra C
- Page 505 and 506:
Please protect the our treasured wi
- Page 507 and 508:
Fran Post 254 Woodland Ave Port Tow
- Page 509 and 510:
Blain, Lindsay (ECY) From: Sierra C
- Page 511 and 512:
Blain, Lindsay (ECY) From: Sierra C
- Page 513 and 514:
Blain, Lindsay (ECY) From: Sierra C
- Page 515 and 516:
Blain, Lindsay (ECY) From: Sierra C
- Page 517 and 518:
Blain, Lindsay (ECY) From: Sierra C
- Page 519 and 520:
Blain, Lindsay (ECY) From: Earthjus
- Page 521 and 522:
Blain, Lindsay (ECY) From: Sierra C
- Page 523 and 524:
Blain, Lindsay (ECY) From: Sierra C
- Page 525 and 526:
Blain, Lindsay (ECY) From: Sierra C
- Page 527 and 528:
Blain, Lindsay (ECY) From: Sierra C
- Page 529 and 530:
Blain, Lindsay (ECY) From: Sierra C
- Page 531 and 532:
Blain, Lindsay (ECY) From: Sierra C
- Page 533 and 534:
Blain, Lindsay (ECY) From: Sierra C
- Page 535 and 536:
Blain, Lindsay (ECY) From: Sierra C
- Page 537 and 538:
Blain, Lindsay (ECY) From: Sierra C
- Page 539 and 540:
16226 N Sands Rd Mead, WA 99021‐7
- Page 541 and 542:
Seattle, WA 98102‐5959 2 K - 117
- Page 543 and 544:
(360) 321‐4883 2 K - 119 Final De
- Page 545 and 546:
Thanks for listening. Sincerely, Ed
- Page 547 and 548:
Sincerely, Jody Fox 310 Bellevue Av
- Page 549 and 550:
4208 Glasgow Way Anacortes, WA 9822
- Page 551 and 552:
(206) 363‐6347 2 K - 127 Final De
- Page 553 and 554:
2551 Captains Ct Ferndale, WA 98248
- Page 555 and 556:
Sincerely, Robert Moore 14727 39th
- Page 557 and 558:
Dan & Pat Montague 647 73rd Ave NE
- Page 559 and 560:
David Yao 1538 N 128th St Seattle,
- Page 561 and 562:
Blain, Lindsay (ECY) From: Sierra C
- Page 563 and 564:
Blain, Lindsay (ECY) From: Sierra C
- Page 565 and 566:
100 years or more. Now there are mo
- Page 567 and 568:
Sincerely, James Rosenthal PO Box 6
- Page 569 and 570:
2 K - 145 Final December 2010
- Page 571 and 572:
Blain, Lindsay (ECY) From: Sierra C
- Page 573 and 574:
Blain, Lindsay (ECY) From: Sierra C
- Page 575 and 576:
Blain, Lindsay (ECY) From: Sierra C
- Page 577 and 578:
Blain, Lindsay (ECY) From: Sierra C
- Page 579 and 580:
Blain, Lindsay (ECY) From: Earthjus
- Page 581 and 582:
2 K - 157 Final December 2010
- Page 583 and 584:
2 K - 159 Final December 2010
- Page 585 and 586:
Nitrogen oxide pollution is also a
- Page 587 and 588:
Sincerely, Eileen Lamar 832 Lacey,
- Page 589 and 590:
Blain, Lindsay (ECY) From: Sierra C
- Page 591 and 592:
Blain, Lindsay (ECY) From: Sierra C
- Page 593 and 594:
Blain, Lindsay (ECY) From: Sierra C
- Page 595 and 596:
energy alternatives, stop killing t
- Page 597 and 598:
Blain, Lindsay (ECY) From: Earthjus
- Page 599 and 600:
2 K - 175 Final December 2010
- Page 601 and 602:
Blain, Lindsay (ECY) From: Earthjus
- Page 603 and 604:
Blain, Lindsay (ECY) From: Earthjus
- Page 605 and 606:
Sincerely, Mrs. Kay Ellison 4303 NE
- Page 607 and 608:
Ms. Cynthia Wilson 101 Maple Dr Por
- Page 609 and 610:
13 Village Dr Apt 102 Saugerties, N
- Page 611 and 612:
Janice Holkup 1147 N 93rd St Seattl
- Page 613 and 614:
Blain, Lindsay (ECY) From: Earthjus
- Page 615 and 616:
Blain, Lindsay (ECY) From: Earthjus
- Page 617 and 618:
Blain, Lindsay (ECY) From: Earthjus
- Page 619 and 620:
where wood and coal smoke is pumped
- Page 621 and 622:
percent or greater. Sincerely, Mr.
- Page 623 and 624:
where wood and coal smoke is pumped
- Page 625 and 626:
have emphysema. Not one of us smoke
- Page 627 and 628:
Blain, Lindsay (ECY) From: Earthjus
- Page 629 and 630:
Blain, Lindsay (ECY) From: Earthjus
- Page 631 and 632:
Blain, Lindsay (ECY) From: Earthjus
- Page 633 and 634:
Blain, Lindsay (ECY) From: Earthjus
- Page 635 and 636:
Blain, Lindsay (ECY) From: Earthjus
- Page 637 and 638:
Blain, Lindsay (ECY) From: Earthjus
- Page 639 and 640:
Blain, Lindsay (ECY) From: Earthjus
- Page 641 and 642:
Blain, Lindsay (ECY) From: Earthjus
- Page 643 and 644:
Blain, Lindsay (ECY) From: Earthjus
- Page 645 and 646:
Ms. Yovonne Autrey‐Schell 360 Duc
- Page 647 and 648:
Unit 2B Bainbridge Island, WA 98110
- Page 649 and 650:
Blain, Lindsay (ECY) From: Earthjus
- Page 651 and 652:
Blain, Lindsay (ECY) From: Earthjus
- Page 653 and 654:
Blain, Lindsay (ECY) From: Earthjus
- Page 655 and 656:
Blain, Lindsay (ECY) From: Earthjus
- Page 657 and 658:
Blain, Lindsay (ECY) From: Earthjus
- Page 659 and 660:
Blain, Lindsay (ECY) From: Earthjus
- Page 661 and 662:
Blain, Lindsay (ECY) From: Earthjus
- Page 663 and 664:
Blain, Lindsay (ECY) From: Earthjus
- Page 665 and 666:
Blain, Lindsay (ECY) From: Earthjus
- Page 667 and 668:
Blain, Lindsay (ECY) From: Earthjus
- Page 669 and 670:
Blain, Lindsay (ECY) From: Earthjus
- Page 671 and 672:
Blain, Lindsay (ECY) From: Earthjus
- Page 673 and 674:
Blain, Lindsay (ECY) From: Earthjus
- Page 675 and 676:
Blain, Lindsay (ECY) From: Earthjus
- Page 677 and 678:
Blain, Lindsay (ECY) From: Earthjus
- Page 679 and 680:
Blain, Lindsay (ECY) From: Earthjus
- Page 681 and 682:
Blain, Lindsay (ECY) From: Earthjus
- Page 683 and 684:
Blain, Lindsay (ECY) From: Sierra C
- Page 685 and 686:
Sincerely, Kathleen Mckeehen PO Box
- Page 687 and 688:
Blain, Lindsay (ECY) From: Sierra C
- Page 689 and 690:
Blain, Lindsay (ECY) From: Sierra C
- Page 691 and 692:
Valley, WA 99181‐9718 2 K - 267 F
- Page 693 and 694:
6204 N Morton St Spokane, WA 99208
- Page 695 and 696:
Gerald Myers 539 Cedar Ave S Renton
- Page 697 and 698:
Please protect the our treasured wi
- Page 699 and 700:
Marilyn Smith 1415 8th St Clarkston
- Page 701 and 702:
from harm by revising the Regional
- Page 703 and 704:
McCleary, WA 98557‐0328 2 K - 279
- Page 705 and 706:
Sincerely, Lyz Kurnitz‐Thurlow 55
- Page 707 and 708:
Sincerely, Mr. Edwin Crayton 218 2n
- Page 709 and 710:
Blain, Lindsay (ECY) From: Sierra C
- Page 711 and 712:
or greater. Sincerely, Ron Good PO
- Page 713 and 714:
increasingly fragile planet. Sincer
- Page 715 and 716:
Jerry Barr 22910 90th Ave W Unit C3
- Page 717 and 718:
Blain, Lindsay (ECY) From: Sierra C
- Page 719 and 720:
Ms. Janet Bautista 6225 64th Ave W
- Page 721 and 722:
Mr. Eugene Ayres Lake Forest Park,
- Page 723 and 724:
Doug Schneider Department of Ecolog
- Page 725 and 726:
Doug Schneider Department of Ecolog
- Page 727 and 728:
Doug Schneider Department of Ecolog
- Page 729 and 730:
Doug Schneider Department of Ecolog
- Page 731 and 732:
Doug Schneider Department of Ecolog
- Page 733 and 734:
Doug Schneider Department of Ecolog
- Page 735 and 736:
Doug Schneider Department of Ecolog
- Page 737 and 738:
Doug Schneider Department of Ecolog
- Page 739 and 740:
Doug Schneider Department of Ecolog
- Page 741 and 742:
Doug Schneider Department of Ecolog
- Page 743 and 744:
Doug Schneider Department of Ecolog
- Page 745 and 746:
Doug Schneider Department of Ecolog
- Page 747 and 748:
K - 323 Final December 2010
- Page 749 and 750:
Final December 2010 18 Wisconsin Po
- Page 751 and 752:
and 5. These emissions limits are a
- Page 753 and 754:
hard copy location (e.g., copyright
- Page 755 and 756:
I. Background F. Executive Order 13
- Page 757 and 758:
that “current scientific knowledg
- Page 759 and 760:
those provisions.” 40 CFR §49.3.
- Page 761 and 762:
visibility impairment at the Grand
- Page 763 and 764:
The Court of Appeals for the Tenth
- Page 765 and 766:
predicted impact of 0.5 dv or more
- Page 767 and 768:
Gunnison Wilderness Area (WA), Cany
- Page 769 and 770:
form nitric acid. In the atmosphere
- Page 771 and 772:
NOx in 2009, 3 was built roughly fo
- Page 773 and 774:
fuel-bound nitrogen and high temper
- Page 775 and 776:
Unit 3 0.39 0.23 0.39 0.32 Unit 4 0
- Page 777 and 778:
In our ANPRM, EPA questioned the ab
- Page 779 and 780:
A subsequent report prepared by APS
- Page 781 and 782:
estimates for each unit. All of the
- Page 783 and 784:
Table 2: EPA, NPS, and APS Cost Eff
- Page 785 and 786:
Based on an economic analysis of th
- Page 787 and 788:
EPA concludes that the energy and n
- Page 789 and 790:
compared. Thus, an increase in visu
- Page 791 and 792:
approach that is more consistent wi
- Page 793 and 794:
concentrations in the Four Corners
- Page 795 and 796:
each Class I area for each year, av
- Page 797 and 798:
determined to all have similar leve
- Page 799 and 800:
e the most likely choice for APS fo
- Page 801 and 802:
units built after 1978 and the PM l
- Page 803 and 804:
Kilometers (km) Delta dv Delta dv %
- Page 805 and 806:
III. EPA Proposed Action on Materia
- Page 807 and 808:
facilities usually were subject to
- Page 809 and 810:
search data sources; complete and r
- Page 811 and 812:
direct compliance costs on the Nava
- Page 813 and 814:
with tribal officials early in the
- Page 815 and 816:
disproportionate effect on children
- Page 817 and 818:
J. Executive Order 12898: Federal A
- Page 819 and 820:
identifies the control equipment an
- Page 821 and 822:
heat inputs, in millions of BTU, fo
- Page 823 and 824:
Note: Multiple copies of this form
- Page 825 and 826:
Blain, Lindsay (ECY) From: Site Adm
- Page 827 and 828:
Blain, Lindsay (ECY) From: Site Adm
- Page 829 and 830:
Blain, Lindsay (ECY) From: Site Adm
- Page 831 and 832:
Blain, Lindsay (ECY) From: Site Adm
- Page 833 and 834:
Blain, Lindsay (ECY) From: Site Adm
- Page 835 and 836:
Blain, Lindsay (ECY) From: Site Adm
- Page 837 and 838:
Blain, Lindsay (ECY) From: Site Adm
- Page 839 and 840:
Blain, Lindsay (ECY) From: Site Adm
- Page 841 and 842:
Blain, Lindsay (ECY) From: Site Adm
- Page 843 and 844:
Blain, Lindsay (ECY) From: Site Adm
- Page 845 and 846:
Blain, Lindsay (ECY) From: Site Adm
- Page 847 and 848:
Blain, Lindsay (ECY) From: Site Adm
- Page 849 and 850:
Blain, Lindsay (ECY) From: Site Adm
- Page 851 and 852:
Blain, Lindsay (ECY) From: Site Adm
- Page 853 and 854:
Blain, Lindsay (ECY) From: Site Adm
- Page 855 and 856:
Blain, Lindsay (ECY) From: Site Adm
- Page 857 and 858:
Blain, Lindsay (ECY) From: Site Adm
- Page 859 and 860:
Blain, Lindsay (ECY) From: Site Adm
- Page 861 and 862:
Blain, Lindsay (ECY) From: Site Adm
- Page 863 and 864:
Blain, Lindsay (ECY) From: Site Adm
- Page 865 and 866:
Blain, Lindsay (ECY) From: Site Adm
- Page 867 and 868:
Blain, Lindsay (ECY) From: Site Adm
- Page 869 and 870:
Blain, Lindsay (ECY) From: Site Adm
- Page 871 and 872:
Blain, Lindsay (ECY) From: Site Adm
- Page 873 and 874:
Blain, Lindsay (ECY) From: Site Adm
- Page 875 and 876:
Blain, Lindsay (ECY) From: Site Adm
- Page 877 and 878:
Blain, Lindsay (ECY) From: Site Adm
- Page 879 and 880:
Blain, Lindsay (ECY) From: Site Adm
- Page 881 and 882:
Blain, Lindsay (ECY) From: Site Adm
- Page 883 and 884:
Blain, Lindsay (ECY) From: Site Adm
- Page 885 and 886:
Blain, Lindsay (ECY) From: Site Adm
- Page 887 and 888:
Blain, Lindsay (ECY) From: Site Adm
- Page 889 and 890:
Blain, Lindsay (ECY) From: Site Adm
- Page 891 and 892:
Blain, Lindsay (ECY) From: Site Adm
- Page 893 and 894:
Blain, Lindsay (ECY) From: Site Adm
- Page 895 and 896:
Blain, Lindsay (ECY) From: Site Adm
- Page 897 and 898:
Blain, Lindsay (ECY) From: Site Adm
- Page 899 and 900:
Blain, Lindsay (ECY) From: Site Adm
- Page 901 and 902:
Blain, Lindsay (ECY) From: Site Adm
- Page 903 and 904:
Blain, Lindsay (ECY) From: Site Adm
- Page 905 and 906:
Blain, Lindsay (ECY) From: Site Adm
- Page 907 and 908:
Blain, Lindsay (ECY) From: Site Adm
- Page 909 and 910:
Blain, Lindsay (ECY) From: Site Adm
- Page 911 and 912:
Blain, Lindsay (ECY) From: Site Adm
- Page 913 and 914:
Blain, Lindsay (ECY) From: Site Adm
- Page 915 and 916:
Blain, Lindsay (ECY) From: Site Adm
- Page 917 and 918:
Blain, Lindsay (ECY) From: Site Adm
- Page 919 and 920:
Blain, Lindsay (ECY) From: Site Adm
- Page 921 and 922:
Blain, Lindsay (ECY) From: Site Adm
- Page 923 and 924:
Blain, Lindsay (ECY) From: Site Adm
- Page 925 and 926:
Blain, Lindsay (ECY) From: Site Adm
- Page 927 and 928:
Blain, Lindsay (ECY) From: Site Adm
- Page 929 and 930:
Blain, Lindsay (ECY) From: Site Adm
- Page 931 and 932:
Blain, Lindsay (ECY) From: Site Adm
- Page 933 and 934:
Blain, Lindsay (ECY) From: Site Adm
- Page 935 and 936:
Blain, Lindsay (ECY) From: Site Adm
- Page 937 and 938:
Blain, Lindsay (ECY) From: Site Adm
- Page 939 and 940:
Blain, Lindsay (ECY) From: Site Adm
- Page 941 and 942:
Blain, Lindsay (ECY) From: Site Adm
- Page 943 and 944:
Blain, Lindsay (ECY) From: Site Adm
- Page 945 and 946:
Blain, Lindsay (ECY) From: Site Adm
- Page 947 and 948:
Blain, Lindsay (ECY) From: Site Adm
- Page 949 and 950:
Blain, Lindsay (ECY) From: Site Adm
- Page 951 and 952:
Blain, Lindsay (ECY) From: Site Adm
- Page 953 and 954:
Blain, Lindsay (ECY) From: Site Adm
- Page 955 and 956:
Blain, Lindsay (ECY) From: Site Adm
- Page 957 and 958:
Blain, Lindsay (ECY) From: Site Adm
- Page 959 and 960:
Blain, Lindsay (ECY) From: Site Adm
- Page 961 and 962:
Blain, Lindsay (ECY) From: Site Adm
- Page 963 and 964:
Blain, Lindsay (ECY) From: Site Adm
- Page 965 and 966:
Blain, Lindsay (ECY) From: Site Adm
- Page 967 and 968:
Blain, Lindsay (ECY) From: Site Adm
- Page 969 and 970:
Blain, Lindsay (ECY) From: Site Adm
- Page 971 and 972:
Blain, Lindsay (ECY) From: Site Adm
- Page 973 and 974:
Blain, Lindsay (ECY) From: Site Adm
- Page 975 and 976:
Blain, Lindsay (ECY) From: Site Adm
- Page 977 and 978:
Blain, Lindsay (ECY) From: Site Adm
- Page 979 and 980:
Blain, Lindsay (ECY) From: Site Adm
- Page 981 and 982:
Blain, Lindsay (ECY) From: Site Adm
- Page 983 and 984:
Blain, Lindsay (ECY) From: Site Adm
- Page 985 and 986:
Blain, Lindsay (ECY) From: Site Adm
- Page 987 and 988:
Blain, Lindsay (ECY) From: Site Adm
- Page 989 and 990:
Blain, Lindsay (ECY) From: Site Adm
- Page 991 and 992:
Blain, Lindsay (ECY) From: Site Adm
- Page 993 and 994:
TransAlta would have on all twelve
- Page 995 and 996:
oxide emissions that would reduce p
- Page 997 and 998:
Technical Comments on the Public Re
- Page 999 and 1000:
problems related to specific circum
- Page 1001 and 1002:
Ecology also states that there is a
- Page 1003 and 1004:
applications will require significa
- Page 1005 and 1006:
higher resolution, perhaps 10 meter
- Page 1007 and 1008:
knowing whether or not the change i
- Page 1009 and 1010:
Respectfully, Dale Swedberg, Chair
- Page 1011 and 1012:
Appendix A Benefits of Fire velutin
- Page 1013 and 1014:
K - 589 Final December 2010
- Page 1015 and 1016:
K - 591 Final December 2010
- Page 1017 and 1018:
K - 593 Final December 2010
- Page 1019 and 1020:
K - 595 Final December 2010
- Page 1021 and 1022:
K - 597 Final December 2010
- Page 1023 and 1024:
K - 599 Final December 2010
- Page 1025 and 1026:
K - 601 Final December 2010
- Page 1027 and 1028:
K - 603 Final December 2010
- Page 1029 and 1030:
K - 605 Final December 2010
- Page 1031 and 1032:
K - 607 Final December 2010
- Page 1033 and 1034:
K - 609 Final December 2010
- Page 1035 and 1036:
K - 611 Final December 2010
- Page 1037 and 1038:
K - 613 Final December 2010
- Page 1039 and 1040:
K - 615 Final December 2010
- Page 1041 and 1042:
K - 617 Final December 2010
- Page 1043 and 1044:
K - 619 Final December 2010
- Page 1045 and 1046:
K - 621 Final December 2010
- Page 1047 and 1048:
K - 623 Final December 2010
- Page 1049 and 1050:
K - 625 Final December 2010
- Page 1051 and 1052:
K - 627 Final December 2010
- Page 1053 and 1054:
K - 629 Final December 2010
- Page 1055 and 1056:
K - 631 Final December 2010
- Page 1057 and 1058:
K - 633 Final December 2010
- Page 1059 and 1060:
K - 635 Final December 2010
- Page 1061 and 1062:
K - 637 Final December 2010
- Page 1063 and 1064:
K - 639 Final December 2010
- Page 1065 and 1066:
K - 641 Final December 2010
- Page 1067 and 1068:
K - 643 Final December 2010
- Page 1069 and 1070:
K - 645 Final December 2010
- Page 1071 and 1072:
K - 647 Final December 2010
- Page 1073 and 1074:
K - 649 Final December 2010
- Page 1075 and 1076:
K - 651 Final December 2010
- Page 1077 and 1078:
K - 653 Final December 2010
- Page 1079 and 1080:
K - 655 Final December 2010
- Page 1081 and 1082:
K - 657 Final December 2010
- Page 1083 and 1084:
K - 659 Final December 2010
- Page 1085 and 1086:
K - 661 Final December 2010
- Page 1087 and 1088:
K - 663 Final December 2010
- Page 1089 and 1090:
K - 665 Final December 2010
- Page 1091 and 1092:
K - 667 Final December 2010
- Page 1093 and 1094:
K - 669 Final December 2010
- Page 1095 and 1096:
K - 671 Final December 2010
- Page 1097 and 1098:
K - 673 Final December 2010
- Page 1099 and 1100:
K - 675 Final December 2010
- Page 1101 and 1102:
K - 677 Final December 2010
- Page 1103 and 1104:
K - 679 Final December 2010
- Page 1105 and 1106:
K - 681 Final December 2010
- Page 1107 and 1108:
Final December 2010 make tonight an
- Page 1109 and 1110:
Final December 2010 We generated an
- Page 1111 and 1112:
Final December 2010 existing system
- Page 1113 and 1114:
The National Park Service will be s
- Page 1115 and 1116:
We have members and leaders who are
- Page 1117 and 1118:
Once we decide to stop all the othe
- Page 1119 and 1120:
Jerry Thielen: Thank you. Is it Fin
- Page 1121 and 1122:
Final December 2010 I’m hearing i
- Page 1123 and 1124:
Jerry Thielen: You can take it out
- Page 1125 and 1126:
K - 701 Final December 2010
- Page 1127 and 1128:
K - 703 Final December 2010
- Page 1129 and 1130:
K - 705 Final December 2010
- Page 1131 and 1132:
K - 707 Final December 2010
- Page 1133 and 1134:
K - 709 Final December 2010
- Page 1135 and 1136:
K - 711 Final December 2010
- Page 1137 and 1138:
K - 713 Final December 2010
- Page 1139 and 1140:
K - 715 Final December 2010
- Page 1141 and 1142:
From: Thielen, Jerry (ECY) To: Clar
- Page 1143 and 1144:
Overview of Appendix L Contents Fin
- Page 1145 and 1146:
Table L-1 Issued Compliance Orders
- Page 1147 and 1148:
BART DETERMINATION SUPPORT DOCUMENT
- Page 1149 and 1150:
EXECUTIVE SUMMARY The Best Availabl
- Page 1151 and 1152:
Table ES-1. ECOLOGY’S DETERMINATI
- Page 1153 and 1154:
September 4, 2009 1. INTRODUCTION T
- Page 1155 and 1156:
September 4, 2009 Table 1-1 below l
- Page 1157 and 1158:
September 4, 2009 1.3 BART-Eligible
- Page 1159 and 1160:
September 4, 2009 The two BART-elig
- Page 1161 and 1162:
September 4, 2009 Final December 20
- Page 1163 and 1164:
September 4, 2009 BP proposed conti
- Page 1165 and 1166:
September 4, 2009 LNBs plus SCR: BP
- Page 1167 and 1168:
September 4, 2009 R-4 HC Reactor He
- Page 1169 and 1170:
September 4, 2009 Overview of Avail
- Page 1171 and 1172:
September 4, 2009 3. Proper design
- Page 1173 and 1174:
September 4, 2009 15-1451 1st Stage
- Page 1175 and 1176:
September 4, 2009 identify any addi
- Page 1177 and 1178:
September 4, 2009 LNBs in the TGU:
- Page 1179 and 1180:
September 4, 2009 effect on Class I
- Page 1181 and 1182:
September 4, 2009 The results prese
- Page 1183 and 1184:
September 4, 2009 Ecology recognize
- Page 1185 and 1186:
September 4, 2009 APPENDIX A. PRINC
- Page 1187 and 1188:
BART Support Document Page 35 of 35
- Page 1189 and 1190:
L - 48 Final December 2010
- Page 1191 and 1192:
L - 50 Final December 2010
- Page 1193 and 1194:
L - 52 Final December 2010
- Page 1195 and 1196:
L - 54 Final December 2010
- Page 1197 and 1198:
L - 56 Final December 2010
- Page 1199 and 1200:
L - 58 Final December 2010
- Page 1201 and 1202:
BART DETERMINATION SUPPORT DOCUMENT
- Page 1203 and 1204:
EXECUTIVE SUMMARY The Best Availabl
- Page 1205 and 1206:
March 3, 2009, Revised February 4,
- Page 1207 and 1208:
March 3, 2009, Revised February 4,
- Page 1209 and 1210:
March 3, 2009, Revised February 4,
- Page 1211 and 1212:
March 3, 2009, Revised February 4,
- Page 1213 and 1214:
March 3, 2009, Revised February 4,
- Page 1215 and 1216:
March 3, 2009, Revised February 4,
- Page 1217 and 1218:
March 3, 2009, Revised February 4,
- Page 1219 and 1220:
March 3, 2009, Revised February 4,
- Page 1221 and 1222:
March 3, 2009, Revised February 4,
- Page 1223 and 1224:
March 3, 2009, Revised February 4,
- Page 1225 and 1226:
BART Support Document Page 21 of 23
- Page 1227 and 1228:
BART Support Document Page 23 of 23
- Page 1229 and 1230:
L - 88 Final December 2010
- Page 1231 and 1232:
L - 90 Final December 2010
- Page 1233 and 1234:
L - 92 Final December 2010
- Page 1235 and 1236:
L - 94 Final December 2010
- Page 1237 and 1238:
L - 96 Final December 2010
- Page 1239 and 1240:
L - 98 Final December 2010
- Page 1241 and 1242:
L - 100 Final December 2010
- Page 1243 and 1244:
BART DETERMINATION SUPPORT DOCUMENT
- Page 1245 and 1246:
EXECUTIVE SUMMARY Final December 20
- Page 1247 and 1248:
July 22, 2009, Revised Feb. 22, 201
- Page 1249 and 1250:
July 22, 2009, Revised Feb. 22, 201
- Page 1251 and 1252:
July 22, 2009, Revised Feb. 22, 201
- Page 1253 and 1254:
July 22, 2009, Revised Feb. 22, 201
- Page 1255 and 1256:
July 22, 2009, Revised Feb. 22, 201
- Page 1257 and 1258:
July 22, 2009, Revised Feb. 22, 201
- Page 1259 and 1260:
July 22, 2009, Revised Feb. 22, 201
- Page 1261 and 1262:
July 22, 2009, Revised Feb. 22, 201
- Page 1263 and 1264:
July 22, 2009, Revised Feb. 22, 201
- Page 1265 and 1266:
July 22, 2009, Revised Feb. 22, 201
- Page 1267 and 1268:
July 22, 2009, Revised Feb. 22, 201
- Page 1269 and 1270:
July 22, 2009, Revised Feb. 22, 201
- Page 1271 and 1272:
July 22, 2009, Revised Feb. 22, 201
- Page 1273 and 1274:
July 22, 2009, Revised Feb. 22, 201
- Page 1275 and 1276:
July 22, 2009, Revised Feb. 22, 201
- Page 1277 and 1278:
July 22, 2009, Revised Feb. 22, 201
- Page 1279 and 1280:
July 22, 2009, Revised Feb. 22, 201
- Page 1281 and 1282:
July 22, 2009, Revised Feb. 22, 201
- Page 1283 and 1284:
July 22, 2009, Revised Feb. 22, 201
- Page 1285 and 1286:
July 22, 2009, Revised Feb. 22, 201
- Page 1287 and 1288:
July 22, 2009, Revised Feb. 22, 201
- Page 1289 and 1290:
July 22, 2009, Revised Feb. 22, 201
- Page 1291 and 1292:
July 22, 2009, Revised Feb. 22, 201
- Page 1293 and 1294:
BART Support Document Page 47 of 44
- Page 1295 and 1296:
L - 154 Final December 2010
- Page 1297 and 1298:
L - 156 Final December 2010
- Page 1299 and 1300:
L - 158 Final December 2010
- Page 1301 and 1302:
L - 160 Final December 2010
- Page 1303 and 1304:
L - 162 Final December 2010
- Page 1305 and 1306:
L - 164 Final December 2010
- Page 1307 and 1308:
L - 166 Final December 2010
- Page 1309 and 1310:
L - 168 Final December 2010
- Page 1311 and 1312:
TABLE OF CONTENTS Final December 20
- Page 1313 and 1314:
EXECUTIVE SUMMARY The Best Availabl
- Page 1315 and 1316:
August 24, 2009, Revised February 4
- Page 1317 and 1318:
August 24, 2009, Revised February 4
- Page 1319 and 1320:
August 24, 2009, Revised February 4
- Page 1321 and 1322:
August 24, 2009, Revised February 4
- Page 1323 and 1324:
August 24, 2009, Revised February 4
- Page 1325 and 1326:
August 24, 2009, Revised February 4
- Page 1327 and 1328:
August 24, 2009, Revised February 4
- Page 1329 and 1330: August 24, 2009, Revised February 4
- Page 1331 and 1332: August 24, 2009, Revised February 4
- Page 1333 and 1334: August 24, 2009, Revised February 4
- Page 1335 and 1336: August 24, 2009, Revised February 4
- Page 1337 and 1338: August 24, 2009, Revised February 4
- Page 1339 and 1340: August 24, 2009, Revised February 4
- Page 1341 and 1342: August 24, 2009, Revised February 4
- Page 1343 and 1344: August 24, 2009, Revised February 4
- Page 1345 and 1346: August 24, 2009, Revised February 4
- Page 1347 and 1348: August 24, 2009, Revised February 4
- Page 1349 and 1350: August 24, 2009, Revised February 4
- Page 1351 and 1352: August 24, 2009, Revised February 4
- Page 1353 and 1354: August 24, 2009, Revised February 4
- Page 1355 and 1356: BART Support Document Page 42 of 42
- Page 1357 and 1358: L - 216 Final December 2010
- Page 1359 and 1360: L - 218 Final December 2010
- Page 1361 and 1362: L - 220 Final December 2010
- Page 1363 and 1364: L - 222 Final December 2010
- Page 1365 and 1366: TABLE OF CONTENTS Final December 20
- Page 1367 and 1368: October 21, 2008 1. INTRODUCTION Th
- Page 1369 and 1370: October 21, 2008 Final December 201
- Page 1371 and 1372: October 21, 2008 This protocol uses
- Page 1373 and 1374: October 21, 2008 Final December 201
- Page 1375 and 1376: October 21, 2008 Wet lime scrubbing
- Page 1377 and 1378: October 21, 2008 kilns such as this
- Page 1379: October 21, 2008 2.2.4 Proposed BAR
- Page 1383 and 1384: October 21, 2008 visibility impact,
- Page 1385 and 1386: October 21, 2008 4.4 Averaging Peri
- Page 1387 and 1388: Final December 2010 BART Support Do
- Page 1389 and 1390: October 21, 2008 APPENDIX C. ACRONY
- Page 1391 and 1392: L - 250 Final December 2010
- Page 1393 and 1394: L - 252 Final December 2010
- Page 1395 and 1396: L - 254 Final December 2010
- Page 1397 and 1398: L - 256 Final December 2010
- Page 1399 and 1400: Table of Contents Executive Summary
- Page 1401 and 1402: of an order which will result in th
- Page 1403 and 1404: BART Determination Document TransAl
- Page 1405 and 1406: BART Determination Document TransAl
- Page 1407 and 1408: BART Determination Document TransAl
- Page 1409 and 1410: BART Determination Document TransAl
- Page 1411 and 1412: BART Determination Document TransAl
- Page 1413 and 1414: BART Determination Document TransAl
- Page 1415 and 1416: BART Determination Document TransAl
- Page 1417 and 1418: BART Determination Document TransAl
- Page 1419 and 1420: BART Determination Document TransAl
- Page 1421 and 1422: BART Determination Document TransAl
- Page 1423 and 1424: BART Determination Document Page 22
- Page 1425 and 1426: BART Determination Document TransAl
- Page 1427 and 1428: BART Determination Document TransAl
- Page 1429 and 1430: BART Determination Document TransAl
- Page 1431 and 1432:
BART Determination Document TransAl
- Page 1433 and 1434:
BART Determination Document TransAl
- Page 1435 and 1436:
BART Determination Document TransAl
- Page 1437 and 1438:
BART Determination Document TransAl
- Page 1439 and 1440:
BART Determination Document TransAl
- Page 1441 and 1442:
BART Determination Document TransAl
- Page 1443 and 1444:
BART Determination Document TransAl
- Page 1445 and 1446:
BART Determination Document TransAl
- Page 1447 and 1448:
BART Determination Document TransAl
- Page 1449 and 1450:
BART Determination Document TransAl
- Page 1451 and 1452:
BART Determination Document TransAl
- Page 1453 and 1454:
BART Determination Document TransAl
- Page 1455 and 1456:
BART Determination Document TransAl
- Page 1457 and 1458:
BART Determination Document TransAl
- Page 1459 and 1460:
BART Determination Document TransAl
- Page 1461 and 1462:
L - 320 Final December 2010
- Page 1463 and 1464:
L - 322 Final December 2010
- Page 1465 and 1466:
L - 324 Final December 2010
- Page 1467 and 1468:
L - 326 Final December 2010
- Page 1469 and 1470:
L - 328 Final December 2010
- Page 1471 and 1472:
L - 330 Final December 2010
- Page 1473 and 1474:
L - 332 Final December 2010
- Page 1475 and 1476:
BART Determination Document TransAl
- Page 1477 and 1478:
BART Determination Document TransAl
- Page 1479 and 1480:
BART Determination Document TransAl
- Page 1481 and 1482:
BART Determination Document TransAl
- Page 1483 and 1484:
BART Determination Document TransAl
- Page 1485 and 1486:
L - 344 Final December 2010
- Page 1487 and 1488:
L - 346 Final December 2010
- Page 1489 and 1490:
L - 348 Final December 2010
- Page 1491 and 1492:
BART DETERMINATION SUPPORT DOCUMENT
- Page 1493 and 1494:
EXECUTIVE SUMMARY The Best Availabl
- Page 1495 and 1496:
January 22, 2009 As allowed by the
- Page 1497 and 1498:
January 22, 2009 sulfate, sodium ca
- Page 1499 and 1500:
January 22, 2009 mechanisms exist,
- Page 1501 and 1502:
January 22, 2009 Table 2-3. SO2 CON
- Page 1503 and 1504:
January 22, 2009 of the plant out o
- Page 1505 and 1506:
January 22, 2009 At this time, ther
- Page 1507 and 1508:
January 22, 2009 preheaters, feed w
- Page 1509 and 1510:
January 22, 2009 To date, there are
- Page 1511 and 1512:
January 22, 2009 scrubber/forced ox
- Page 1513 and 1514:
January 22, 2009 3. VISIBILITY IMPA
- Page 1515 and 1516:
January 22, 2009 Table 4-1. ECOLOGY
- Page 1517 and 1518:
January 22, 2009 two such units ope
- Page 1519 and 1520:
January 22, 2009 APPENDIX A. PRINCI
- Page 1521 and 1522:
BART Support Document Page 28 of 28
- Page 1523 and 1524:
L - 382 Final December 2010
- Page 1525 and 1526:
L - 384 Final December 2010
- Page 1527 and 1528:
Air Quality Program Notice of Publi
- Page 1529 and 1530:
CORRECTION TO NOTICE PUBLISHED 9/9/
- Page 1531 and 1532:
Ecology’s Response to Comments on
- Page 1533 and 1534:
EPA Region 9 Federal Register Notic
- Page 1535 and 1536:
Final December 2010 scrubbing syste
- Page 1537 and 1538:
The BART process is not focused sol
- Page 1539 and 1540:
The visibility impacts at all Class
- Page 1541 and 1542:
ECOLOGY’S RESPONSE TO COMMENTS ON
- Page 1543 and 1544:
We also did not delve into the actu
- Page 1545 and 1546:
6. Due to the large visibility impa
- Page 1547 and 1548:
• Flex Fuels is not a NOX reducti
- Page 1549 and 1550:
distance is used to evenly distribu
- Page 1551 and 1552:
Step 5 in the EPA guidance document
- Page 1553 and 1554:
State Unit Colorado (cont.) Public
- Page 1555 and 1556:
State Unit Generating Station Unit
- Page 1557 and 1558:
For cost-effectiveness, we are rely
- Page 1559 and 1560:
5. SCR Costs evaluated on a 15-year
- Page 1561 and 1562:
Staff members with Ecology’s Air
- Page 1563 and 1564:
waiting for EPA to complete new rul
- Page 1565 and 1566:
Comments on TransAlta Coal-fired Po
- Page 1567 and 1568:
to be something the Plant already w
- Page 1569 and 1570:
various mines in the PRB with likel
- Page 1571 and 1572:
analysis of how much SCR catalyst w
- Page 1573 and 1574:
(ix) While cost is one factor in th
- Page 1575 and 1576:
opposed to SCR resulting in additio
- Page 1577 and 1578:
coal. It would also appear that Eco
- Page 1579 and 1580:
Via Electronic Mail Sarah Rees Wash
- Page 1581 and 1582:
Ms. Sarah Rees Department of Ecolog
- Page 1583 and 1584:
Ms. Sarah Rees Department of Ecolog
- Page 1585 and 1586:
Ms. Sarah Rees Department of Ecolog
- Page 1587 and 1588:
Ms. Sarah Rees Department of Ecolog
- Page 1589 and 1590:
Ms. Sarah Rees Department of Ecolog
- Page 1591 and 1592:
Ms. Sarah Rees Department of Ecolog
- Page 1593 and 1594:
Ms. Sarah Rees Department of Ecolog
- Page 1595 and 1596:
L - 454 Final December 2010
- Page 1597 and 1598:
L - 456 Final December 2010
- Page 1599 and 1600:
L - 458 Final December 2010
- Page 1601 and 1602:
TransAlta anticipates operating the
- Page 1603 and 1604:
annual basis. In estimating the ann
- Page 1605 and 1606:
The SO2 and PM cost analyses were c
- Page 1607 and 1608:
areas. Our compilation 19 of BART a
- Page 1609 and 1610:
United States Department of Agricul
- Page 1611 and 1612:
eductions in NOx. Even if NOx emiss
- Page 1613 and 1614:
BART Compliance Section of the Sett
- Page 1615 and 1616:
file:///Y|/Regional%20Haze%20SIP/Ju
- Page 1617 and 1618:
file:///Y|/Regional%20Haze%20SIP/Ju
- Page 1619 and 1620:
Jerry: We’re gonna get started in
- Page 1621 and 1622:
Final December 2010 the public comm
- Page 1623 and 1624:
Final December 2010 So what did we
- Page 1625 and 1626:
Final December 2010 So now I’m go
- Page 1627 and 1628:
Final December 2010 contained lower
- Page 1629 and 1630:
potentially different fuels that wo
- Page 1631 and 1632:
world would not directly - you know
- Page 1633 and 1634:
Sarah: EPA has seen our draft BART
- Page 1635 and 1636:
Final December 2010 dirtiest way to
- Page 1637 and 1638:
Final December 2010 We are also con
- Page 1639 and 1640:
The National Park Service’s desir
- Page 1641 and 1642:
So I’m very concerned about that.
- Page 1643 and 1644:
Brimmer: Okay. Jerry: Yeah, go ahea
- Page 1645 and 1646:
Final December 2010 I also want to
- Page 1647 and 1648:
Final December 2010 plan, coal comp
- Page 1649 and 1650:
Final December 2010 necessary docum
- Page 1651 and 1652:
L - 510 Final December 2010
- Page 1653 and 1654:
L - 512 Final December 2010
- Page 1655 and 1656:
L - 514 Final December 2010
- Page 1657 and 1658:
L - 516 Final December 2010
- Page 1659 and 1660:
L - 518 Final December 2010
- Page 1661 and 1662:
Question 1: CENTRALIA BART RESPONSE
- Page 1663 and 1664:
TABLE A Economic Analysis Summary f
- Page 1665 and 1666:
L - 524 Final December 2010
- Page 1667 and 1668:
L - 526 Final December 2010
- Page 1669 and 1670:
L - 528 Final December 2010
- Page 1671 and 1672:
L - 530 Final December 2010
- Page 1673 and 1674:
L - 532 Final December 2010
- Page 1675 and 1676:
L - 534 Final December 2010
- Page 1677 and 1678:
L - 536 Final December 2010
- Page 1679 and 1680:
L - 538 Final December 2010
- Page 1681 and 1682:
L - 540 Final December 2010
- Page 1683 and 1684:
Final December 2010 Additional Info
- Page 1685 and 1686:
CH2M Hill's Cost Component CH2M Hil
- Page 1687 and 1688:
CH2M Hill's Cost Component CONTROL
- Page 1689 and 1690:
Washington State Regional Haze SIP
- Page 1691 and 1692:
Table M-1 Crosswalk between Washing
- Page 1693 and 1694:
M-5 Final December 2010 Public Revi
- Page 1695 and 1696:
Final December 2010 Figure M-2 NOCA
- Page 1697 and 1698:
Final December 2010 Figure M-4 MORA
- Page 1699 and 1700:
M-11 Final December 2010 Public Rev
- Page 1701 and 1702:
M-13 Final December 2010 Public Rev
- Page 1703 and 1704:
THE MOST IMPAIRED DAYS, Winter (Q1
- Page 1705 and 1706:
Conclusion Final December 2010 IMPR
Inappropriate
Loading...
Inappropriate
You have already flagged this document.
Thank you, for helping us keep this platform clean.
The editors will have a look at it as soon as possible.
Mail this publication
Loading...
Embed
Loading...
Delete template?
Are you sure you want to delete your template?
DOWNLOAD ePAPER
This ePaper is currently not available for download.
You can find similar magazines on this topic below under ‘Recommendations’.
