WORLD POPULATION TO 2300
WORLD POPULATION TO 2300
WORLD POPULATION TO 2300

You also want an ePaper? Increase the reach of your titles
YUMPU automatically turns print PDFs into web optimized ePapers that Google loves.
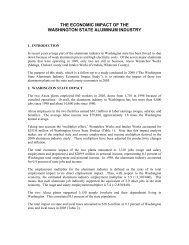
Rate per thousand<br />
40<br />
35<br />
30<br />
25<br />
20<br />
15<br />
10<br />
5<br />
0<br />
Figure 10. Crude birth and death rate and rate of natural increase for the world,<br />
estimates and medium scenario: 1950-<strong>2300</strong><br />
-5<br />
1950 2000 2050 2100 2150 2200 2250 <strong>2300</strong><br />
for most countries. That fluctuations eventuate in<br />
little change in the long run, such that population<br />
in <strong>2300</strong> is not much different from population in<br />
2050, is also common. That fertility first declines<br />
below replacement and then recovers to replacement<br />
level, and that population growth follows,<br />
with turning points about half a century later, is<br />
also a general pattern. The steady rise in life expectancy,<br />
which paradoxically produces an initial<br />
rise in the crude death rate, also appears in many<br />
cases. That high and low scenarios provide a wide<br />
range around the medium scenario is the usual<br />
pattern.<br />
These patterns recur in projections within various<br />
regions and countries. Some things do vary,<br />
however: specific levels of demographic parameters,<br />
as well as the timing of events. Regions and<br />
countries differ in how far fertility and growth<br />
fall, how high the crude death rate rises, and<br />
when exactly these events are projected to happen.<br />
Crude birth rate<br />
Crude death rate<br />
Natural increase<br />
Figure 11 shows the projected time line of demographic<br />
milestones for world population. Similar<br />
events occur in most countries, but along different<br />
time lines. The similarity of patterns might seem<br />
to imply that rates of change for regions and countries<br />
should eventually converge. Whether this is<br />
in fact the case needs to be determined.<br />
C. MORE DEVELOPED AND<br />
LESS DEVELOPED REGIONS<br />
At present and in projections through 2050,<br />
more developed and less developed regions are<br />
strikingly different in demographic terms.<br />
Whether these regions will still be properly distinguished<br />
in the following centuries may be<br />
unlikely but is ultimately impossible to tell. One<br />
can however ask—regardless of what happens to<br />
economic, social, and political distinctions—<br />
whether these regions will remain demographically<br />
distinctive.<br />
United Nations Department of Economic and Social Affairs/Population Division 17<br />
World Population to <strong>2300</strong>