- Page 1 and 2: 9 Fire and ambulance services CONTE
- Page 3 and 4: Roles and responsibilities Fire ser
- Page 5 and 6: and human resources relate to fire
- Page 7 and 8: The Report’s statistical appendix
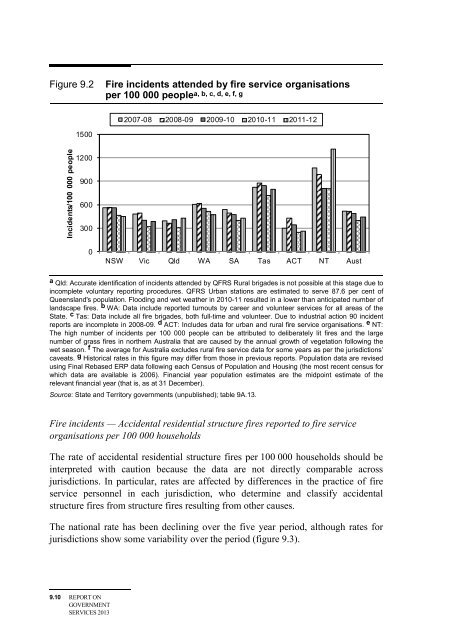
- Page 9: Box 9.2 Fire incidents ‘Fire inci
- Page 13 and 14: Figure 9.5 Fire service organisatio
- Page 15 and 16: Figure 9.7 Reported road crash resc
- Page 17 and 18: Fire/non-fire incidents — False a
- Page 19 and 20: The most recent cross-sectional, na
- Page 21 and 22: • the dispersion of the populatio
- Page 23 and 24: Figure 9.10 Response times to struc
- Page 25 and 26: Both government of funding fire ser
- Page 27 and 28: Box 9.8 Fire death rate ‘Fire dea
- Page 29 and 30: years from 1982-91 the average deat
- Page 31 and 32: Box 9.10 Annual fire injury rate
- Page 33 and 34: The proportion of fires, from all i
- Page 35 and 36: Median dollar loss per structure fi
- Page 37 and 38: 9.4 Profile of emergency services f
- Page 39 and 40: Table 9.3 Revenue of ambulance serv
- Page 41 and 42: Nationally, in 2011-12, 84.6 per ce
- Page 43 and 44: • ambulance operatives (including
- Page 45 and 46: Figure 9.20 Ambulance events perfor
- Page 47 and 48: Figure 9.21 Number of paid, mixed a
- Page 49 and 50: Figure 9.22 Number of full time equ
- Page 51 and 52: Although definitions of response ti
- Page 53 and 54: State-wide response times ‘State-
- Page 55 and 56: Effectiveness — appropriateness A
- Page 57 and 58: Continuity of care ‘Continuity of
- Page 59 and 60: Figure 9.26 Ambulance staff attriti
- Page 61 and 62:
Figure 9.27 Ambulance service organ
- Page 63 and 64:
Cardiac arrest survived event rate
- Page 65 and 66:
Box 9.30 Continued have improved ov
- Page 67 and 68:
Cardiac arrest survival to hospital
- Page 69 and 70:
9.7 Future directions in performanc
- Page 71 and 72:
“ New South Wales Government comm
- Page 73 and 74:
“ Queensland Government comments
- Page 75 and 76:
“ South Australian Government com
- Page 77 and 78:
“ Australian Capital Territory Go
- Page 79 and 80:
9.9 Definitions of key terms Alarm
- Page 81 and 82:
Fire safety measure • Operational
- Page 83 and 84:
9.10 List of attachment tables Atta
- Page 85 and 86:
9.11 References ABS (Australian Bur
- Page 87 and 88:
9A Fire and ambulance services —
- Page 89 and 90:
Attachment contents CONTENTS Table
- Page 91 and 92:
TABLE 9A.1 Table 9A.1 Delivery and
- Page 93 and 94:
Table 9A.2 2009-10 NSW (c) Vic (c)
- Page 95 and 96:
Table 9A.2 NSW (c) Vic (c) TABLE 9A
- Page 97 and 98:
TABLE 9A.3 Table 9A.3 Fire service
- Page 99 and 100:
TABLE 9A.3 Table 9A.3 Fire service
- Page 101 and 102:
Table 9A.4 Fire death rate (a), (b)
- Page 103 and 104:
Table 9A.4 Fire death rate (a), (b)
- Page 105 and 106:
Table 9A.5 Fire deaths (a), (b), (c
- Page 107 and 108:
TABLE 9A.6 Table 9A.6 Landscape fir
- Page 109 and 110:
Table 9A.7 Fire injuries (a), (b),
- Page 111 and 112:
Table 9A.8 All ignition types NSW (
- Page 113 and 114:
Table 9A.9 All ignition types NSW (
- Page 115 and 116:
Table 9A.11 NSW (d) Property loss f
- Page 117 and 118:
Table 9A.12 2011-12 Fires Structure
- Page 119 and 120:
Table 9A.12 Other emergencies and i
- Page 121 and 122:
Table 9A.12 TABLE 9A.12 Reported fi
- Page 123 and 124:
Table 9A.12 2004-05 Fires Structure
- Page 125 and 126:
Table 9A.12 (a) Other emergencies a
- Page 127 and 128:
Table 9A.13 NSW Vic Incidents per 1
- Page 129 and 130:
Table 9A.15 NSW (d) Number of lands
- Page 131 and 132:
Table 9A.16 2011-12 Structure fires
- Page 133 and 134:
Table 9A.16 Next highest ingnition
- Page 135 and 136:
Table 9A.17 TABLE 9A.17 NSW Vic Qld
- Page 137 and 138:
Table 9A.19 Total extrications TABL
- Page 139 and 140:
TABLE 9A.20 Table 9A.20 Prevention
- Page 141 and 142:
TABLE 9A.21 Table 9A.21 Selected fi
- Page 143 and 144:
TABLE 9A.21 Table 9A.21 Selected fi
- Page 145 and 146:
Table 9A.22 (f) (g) (h) (i) TABLE 9
- Page 147 and 148:
Table 9A.23 (e) Jurisdiction notes:
- Page 149 and 150:
Table 9A.24 NSW Vic (a) TABLE 9A.24
- Page 151 and 152:
Table 9A.25 Response times NSW Vic
- Page 153 and 154:
Table 9A.25 WA: SA: Tas: NT: NSW Vi
- Page 155 and 156:
Table 9A.26 Response times NSW Vic
- Page 157 and 158:
Table 9A.26 Qld: WA: SA: Tas: NT: N
- Page 159 and 160:
Table 9A.27 2009-10 Labour costs -
- Page 161 and 162:
Table 9A.27 2005-06 Labour costs -
- Page 163 and 164:
Table 9A.27 (a) (b) (c) (d) (e) (f)
- Page 165 and 166:
Table 9A.28 2011-12 NSW Vic (c) TAB
- Page 167 and 168:
Table 9A.29 2011-12 NSW (d) Vic (d)
- Page 169 and 170:
Table 9A.29 (c) (d) NSW (d) Vic (d)
- Page 171 and 172:
Table 9A.30 2011-12 Revenue sources
- Page 173 and 174:
Table 9A.30 TABLE 9A.30 Major sourc
- Page 175 and 176:
Table 9A.30 2006-07 Revenue sources
- Page 177 and 178:
Table 9A.31 2011-12 Incidents Emerg
- Page 179 and 180:
Table 9A.31 Emergency responses Urg
- Page 181 and 182:
Table 9A.31 (a) (b) (c) TABLE 9A.31
- Page 183 and 184:
Table 9A.32 TABLE 9A.32 Emergency d
- Page 185 and 186:
Table 9A.32 TABLE 9A.32 Emergency d
- Page 187 and 188:
TABLE 9A.33 Table 9A.33 Ambulance s
- Page 189 and 190:
TABLE 9A.33 Table 9A.33 Ambulance s
- Page 191 and 192:
TABLE 9A.33 Table 9A.33 Ambulance s
- Page 193 and 194:
TABLE 9A.33 Table 9A.33 Ambulance s
- Page 195 and 196:
Table 9A.34 TABLE 9A.34 Ambulance s
- Page 197 and 198:
TABLE 9A.35 Table 9A.35 Ambulance a
- Page 199 and 200:
TABLE 9A.35 Table 9A.35 Ambulance a
- Page 201 and 202:
TABLE 9A.36 Table 9A.36 Ambulance r
- Page 203 and 204:
TABLE 9A.36 Table 9A.36 Ambulance r
- Page 205 and 206:
TABLE 9A.37 Table 9A.37 Aero medica
- Page 207 and 208:
TABLE 9A.37 Table 9A.37 Aero medica
- Page 209 and 210:
TABLE 9A.38 Table 9A.38 Cardiac Arr
- Page 211 and 212:
TABLE 9A.38 Table 9A.38 Cardiac Arr
- Page 213 and 214:
TABLE 9A.39 Table 9A.39 Satisfactio
- Page 215 and 216:
TABLE 9A.39 Table 9A.39 Satisfactio
- Page 217 and 218:
TABLE 9A.40 Table 9A.40 Ambulance c
- Page 219 and 220:
TABLE 9A.41 Table 9A.41 Ambulance s
- Page 221 and 222:
TABLE 9A.41 Table 9A.41 Ambulance s
- Page 223 and 224:
TABLE 9A.41 Table 9A.41 Ambulance s
- Page 225 and 226:
Table 9A.42 2011-12 TABLE 9A.42 NSW
- Page 227 and 228:
Table 9A.43 2011-12 TABLE 9A.43 NSW
- Page 229 and 230:
CONTEXT AND OTHER INFORMATION All j
- Page 231 and 232:
TABLE 9A.45 Table 9A.45 Treatment o
- Page 233 and 234:
Data quality information — Fire a
- Page 235 and 236:
Relevance High or increasing number
- Page 237 and 238:
Reported road crash rescue incident
- Page 239 and 240:
to estimate road rescue data. Each
- Page 241 and 242:
Table 2 Calculation of road crash r
- Page 243 and 244:
Table 3 Calculation of road crash r
- Page 245 and 246:
excluded. Structure fire A structur
- Page 247 and 248:
Interpretability Copies of the comp
- Page 249 and 250:
Table 2 Data collection and storage
- Page 251 and 252:
Table 4 Extrapolation and estimatio
- Page 253 and 254:
Annual fire death rate Data quality
- Page 255 and 256:
finalised approximately 13 months a
- Page 257 and 258:
term bushfire is more recognisable
- Page 259 and 260:
Confinement to room/object of origi
- Page 261 and 262:
• extrapolation and estimation (t
- Page 263 and 264:
Table 3 Extrapolation and estimatio
- Page 265 and 266:
production and currency of AIRS dat
- Page 267 and 268:
Value of asset loss appendix: Juris
- Page 269 and 270:
Table 3 Assessing dollar loss for e
- Page 271 and 272:
Ambulance services Response Locatio
- Page 273 and 274:
Workforce by Age Group Data quality
- Page 275 and 276:
Level of patient satisfaction Data
- Page 277:
Interpretability The CAA Patient Sa