
Create successful ePaper yourself
Turn your PDF publications into a flip-book with our unique Google optimized e-Paper software.
NOTES TO CONDENSED INTERIM FINANCIAL REPORT (CONTINUED)<br />
3 SEGMENT INFORMATION (CONTINUED)<br />
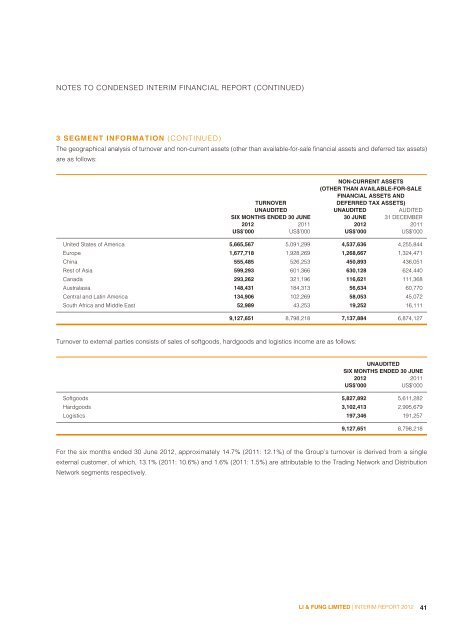
The geographical analysis of turnover and non-current assets (other than available-for-sale financial assets and deferred tax assets)<br />
are as follows:<br />
TURNOVER<br />
NON-CURRENT ASSETS<br />
(OTHER THAN AVAILABLE-FOR-SALE<br />
FINANCIAL ASSETS AND<br />
DEFERRED TAX ASSETS)<br />
UNAUDITED UNAUDITED AUDITED<br />
SIX MONTHS ENDED 30 JUNE 30 JUNE 31 DECEMBER<br />
2012 2011 2012 2011<br />
US$’000 US$’000 US$’000 US$’000<br />
United States of America 5,665,567 5,091,299 4,537,636 4,255,844<br />
Europe 1,677,718 1,928,269 1,268,667 1,324,471<br />
China 555,485 526,253 450,893 436,051<br />
Rest of Asia 599,293 601,366 630,128 624,440<br />
Canada 293,262 321,196 116,621 111,368<br />
Australasia 148,431 184,313 56,634 60,770<br />
Central and Latin America 134,906 102,269 58,053 45,072<br />
South Africa and Middle East 52,989 43,253 19,252 16,111<br />
9,127,651 8,798,218 7,137,884 6,874,127<br />
Turnover to external parties consists of sales of softgoods, hardgoods and logistics income are as follows:<br />
UNAUDITED<br />
SIX MONTHS ENDED 30 JUNE<br />
2012 2011<br />
US$’000 US$’000<br />
Softgoods 5,827,892 5,611,282<br />
Hardgoods 3,102,413 2,995,679<br />
Logistics 197,346 191,257<br />
9,127,651 8,798,218<br />
For the six months ended 30 June 2012, approximately 14.7% (2011: 12.1%) of the Group’s turnover is derived from a single<br />
external customer, of which, 13.1% (2011: 10.6%) and 1.6% (2011: 1.5%) are attributable to the Trading Network and Distribution<br />
Network segments respectively.<br />
LI & FUNG LIMITED | INTERIM REPORT 2012<br />
41