
Create successful ePaper yourself
Turn your PDF publications into a flip-book with our unique Google optimized e-Paper software.
HIGHLIGHTS<br />
HALF YEAR RESULTS TO 30 JUNE 2012<br />
(US$ million) 2012 2011 Change<br />
Turnover 9,128 8,798 +4%<br />
Core Operating Profit 221 282 -22%<br />
As % of Turnover 2.43% 3.21%<br />
Profit attributable to shareholders<br />
of the Company<br />
312 236 +33%<br />
Earnings per Share – Basic 3.80 US cents 2.92 US cents +30%<br />
Dividend per Share 15 HK cents 19 HK cents -21%<br />
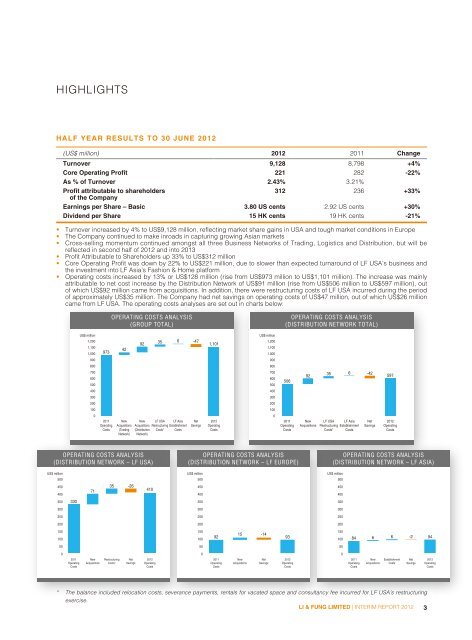
• Turnover increased by 4% to US$9,128 million, reflecting market share gains in USA and tough market conditions in Europe<br />
• The Company continued to make inroads in capturing growing Asian markets<br />
• Cross-selling momentum continued amongst all three Business Networks of Trading, Logistics and Distribution, but will be<br />
reflected in second half of 2012 and into 2013<br />
• Profit Attributable to Shareholders up 33% to US$312 million<br />
• Core Operating Profit was down by 22% to US$221 million, due to slower than expected turnaround of LF USA’s business and<br />
the investment into LF Asia’s Fashion & Home platform<br />
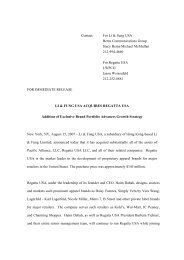
• Operating costs increased by 13% or US$128 million (rise from US$973 million to US$1,101 million). The increase was mainly<br />
attributable to net cost increase by the Distribution Network of US$91 million (rise from US$506 million to US$597 million), out<br />
of which US$92 million came from acquisitions. In addition, there were restructuring costs of LF USA incurred during the period<br />
of approximately US$35 million. The Company had net savings on operating costs of US$47 million, out of which US$26 million<br />
came from LF USA. The operating costs analyses are set out in in ccharts<br />
charts c below:<br />
US$ million<br />
1,200<br />
1,100<br />
1,000<br />
900<br />
800<br />
700<br />
600<br />
500<br />
400<br />
300<br />
200<br />
100<br />
0<br />
973<br />
2011<br />
Operating<br />
Costs<br />
OPERATING COSTS ANALYSIS<br />
(GROUP TOTAL)<br />
New<br />
Acquisitions<br />
(Trading<br />
Network)<br />
New<br />
Acquisitions<br />
(Distribution<br />
Network)<br />
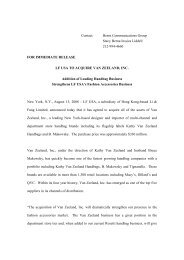
OPERATING COSTS ANALYSIS<br />
(DISTRIBUTION NETWORK – LF USA)<br />
US$ million<br />
500<br />
450<br />
400<br />
350<br />
300<br />
250<br />
200<br />
150<br />
100<br />
50<br />
0<br />
330<br />
2011<br />
Operating<br />
Costs<br />
71<br />
New<br />
Acquisitions<br />
Restructuring<br />
Costs*<br />
42<br />
35 -26<br />
Net<br />
Savings<br />
92<br />
410<br />
2012<br />
Operating<br />
Costs<br />
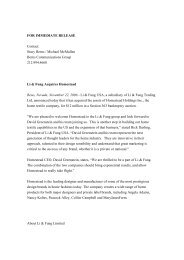
35 6 -47<br />
LF USA<br />
Restructuring<br />
Costs*<br />
LF Asia<br />
Establishment<br />
Costs<br />
Net<br />
Savings<br />
1,101<br />
2012<br />
Operating<br />
Costs<br />
US$ million<br />
1,200<br />
1,100<br />
1,000<br />
900<br />
800<br />
700<br />
600<br />
500<br />
400<br />
300<br />
200<br />
100<br />
0<br />
OPERATING COSTS ANALYSIS<br />
(DISTRIBUTION NETWORK TOTAL)<br />
506<br />
2011<br />
Operating<br />
Costs<br />
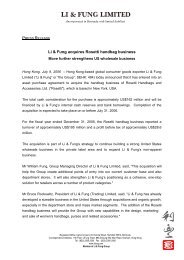
OPERATING COSTS ANALYSIS<br />
(DISTRIBUTION NETWORK – LF EUROPE)<br />
US$ million<br />
500<br />
450<br />
400<br />
350<br />
300<br />
250<br />
200<br />
150<br />
100<br />
50<br />
0<br />
15 -14<br />
92 93<br />
2011<br />
Operating<br />
Costs<br />
New<br />
Acquisitions<br />
Net<br />
Savings<br />
2012<br />
Operating<br />
Costs<br />
92<br />
New<br />
Acquisitions<br />
35 6 -42<br />
LF USA<br />
Restructuring<br />
Costs*<br />
LF Asia<br />
Establishment<br />
Costs<br />
Net<br />
Savings<br />
597<br />
2012<br />
Operating<br />
Costs<br />
OPERATING COSTS ANALYSIS<br />
(DISTRIBUTION NETWORK – LF ASIA)<br />
US$ million<br />
500<br />
450<br />
400<br />
350<br />
300<br />
250<br />
200<br />
150<br />
100<br />
50<br />
0<br />
84<br />
2011<br />
Operating<br />
Costs<br />
6 6 -2<br />
* The balance included relocation costs, severance payments, rentals for vacated space and consultancy fee incurred for LF USA’s restructuring<br />
exercise.<br />
LI & FUNG LIMITED | INTERIM REPORT 2012 3<br />
New<br />
Acquisitions<br />
Establishment<br />
Costs<br />
Net<br />
Savings<br />
94<br />
2012<br />
Operating<br />
Costs