Groundwater arsenic in the Red River delta, Vietnam ... - Fiva
Groundwater arsenic in the Red River delta, Vietnam ... - Fiva
Groundwater arsenic in the Red River delta, Vietnam ... - Fiva

Create successful ePaper yourself
Turn your PDF publications into a flip-book with our unique Google optimized e-Paper software.
3110 F. Larsen et al. / Applied Geochemistry 23 (2008) 3099–3115<br />
and <strong>the</strong> channel bed conductance, and not surpris<strong>in</strong>gly <strong>the</strong><br />
flow across <strong>the</strong> sou<strong>the</strong>rn boundary. The latter model<br />
uncerta<strong>in</strong>ty was reduced by carefully sampl<strong>in</strong>g <strong>the</strong> head<br />
observations along this boundary and <strong>the</strong> uncerta<strong>in</strong>ty has<br />
<strong>the</strong>refore been conf<strong>in</strong>ed to <strong>the</strong> estimated hydraulic conductivity<br />
of <strong>the</strong> sand, which seems well documented. The<br />
estimated conductance of <strong>the</strong> channel appears high and<br />
could very well be wrong by a factor of 5–10. Mean error<br />
(ME) values between simulated and observed hydraulic<br />
heads, us<strong>in</strong>g a uniform recharge rate of 60 mm/a, is<br />
0.57 m <strong>in</strong> <strong>the</strong> calibrated model and 0.60 m <strong>in</strong> <strong>the</strong> validated<br />
model. Increas<strong>in</strong>g <strong>the</strong> recharge rate gave larger errors and<br />
with a recharge rate of 100 mm/a, <strong>the</strong> ME values of <strong>the</strong> calibrated<br />
and validated model <strong>in</strong>creased to 0.77 m and<br />
0.80 m, respectively. The mean absolute errors (MAE) <strong>in</strong><br />
<strong>the</strong> validated model with a recharge of 60 and 100 mm/a<br />
were 0.78 and 0.93 m, respectively. Given <strong>the</strong> above<br />
mentioned uncerta<strong>in</strong>ties <strong>in</strong> <strong>the</strong> flux across <strong>the</strong> sou<strong>the</strong>rn<br />
boundary and <strong>the</strong> conductance of <strong>the</strong> channels, <strong>the</strong> uncerta<strong>in</strong>ty<br />
on <strong>the</strong> calibrated recharge rate alone from percolation<br />
could work equally well with a percolation of<br />
100 mm/a. Increas<strong>in</strong>g <strong>the</strong> recharge rate to much more<br />
than 100 mm/a is not possible with <strong>the</strong> calibrated flow<br />
model without simulat<strong>in</strong>g unrealistically high hydraulic<br />
heads.<br />
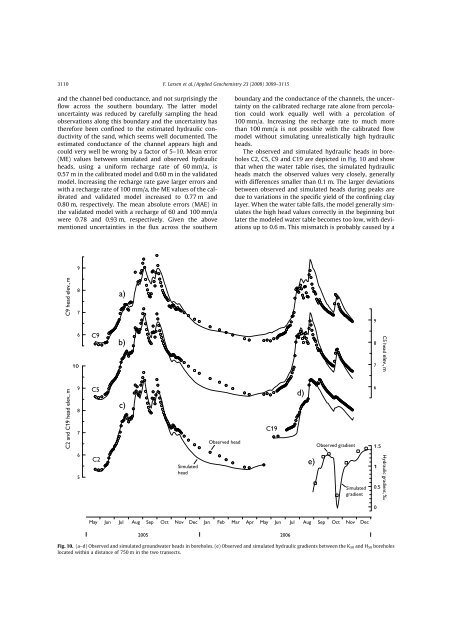
The observed and simulated hydraulic heads <strong>in</strong> boreholes<br />
C2, C5, C9 and C19 are depicted <strong>in</strong> Fig. 10 and show<br />
that when <strong>the</strong> water table rises, <strong>the</strong> simulated hydraulic<br />
heads match <strong>the</strong> observed values very closely, generally<br />
with differences smaller than 0.1 m. The larger deviations<br />
between observed and simulated heads dur<strong>in</strong>g peaks are<br />
due to variations <strong>in</strong> <strong>the</strong> specific yield of <strong>the</strong> conf<strong>in</strong><strong>in</strong>g clay<br />
layer. When <strong>the</strong> water table falls, <strong>the</strong> model generally simulates<br />
<strong>the</strong> high head values correctly <strong>in</strong> <strong>the</strong> beg<strong>in</strong>n<strong>in</strong>g but<br />
later <strong>the</strong> modeled water table becomes too low, with deviations<br />
up to 0.6 m. This mismatch is probably caused by a<br />
Fig. 10. (a–d) Observed and simulated groundwater heads <strong>in</strong> boreholes. (e) Observed and simulated hydraulic gradients between <strong>the</strong> K 50 and H 50 boreholes<br />
located with<strong>in</strong> a distance of 750 m <strong>in</strong> <strong>the</strong> two transects.