Dye Separation - Leica Microsystems
Dye Separation - Leica Microsystems
Dye Separation - Leica Microsystems

You also want an ePaper? Increase the reach of your titles
YUMPU automatically turns print PDFs into web optimized ePapers that Google loves.
6 Confocal Application Letter<br />
1.3 Manual <strong>Dye</strong> <strong>Separation</strong><br />
In the Manual tool the distribution coeffi cients<br />
are not calculated by the system but are estimated<br />
by the user, i.e. no references are needed. Let’s<br />
explain it using the example described above.<br />
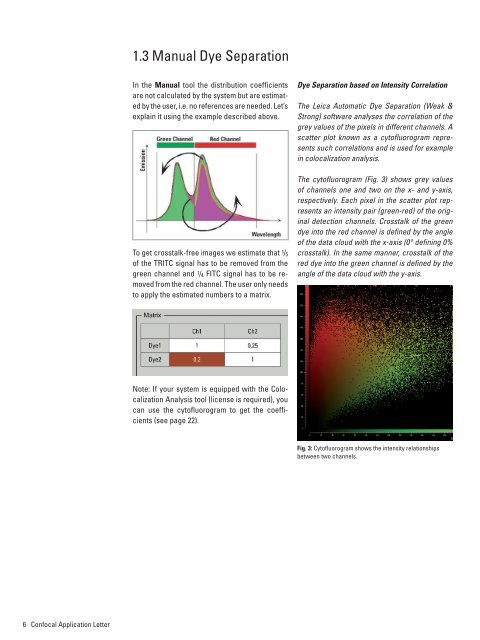
To get crosstalk-free images we estimate that 1/5<br />
of the TRITC signal has to be removed from the<br />
green channel and 1/4 FITC signal has to be removed<br />
from the red channel. The user only needs<br />
to apply the estimated numbers to a matrix.<br />
Note: If your system is equipped with the Colocalization<br />
Analysis tool (license is required), you<br />
can use the cytofl uorogram to get the coeffi -<br />
cients (see page 22).<br />
<strong>Dye</strong> <strong>Separation</strong> based on Intensity Correlation<br />
The <strong>Leica</strong> Automatic <strong>Dye</strong> <strong>Separation</strong> (Weak &<br />
Strong) software analyses the correlation of the<br />
grey values of the pixels in different channels. A<br />
scatter plot known as a cytofl uorogram represents<br />
such correlations and is used for example<br />
in colocalization analysis.<br />
The cytofl uorogram (Fig. 3) shows grey values<br />
of channels one and two on the x- and y-axis,<br />
respectively. Each pixel in the scatter plot represents<br />
an intensity pair (green-red) of the original<br />
detection channels. Crosstalk of the green<br />
dye into the red channel is defi ned by the angle<br />
of the data cloud with the x-axis (0° defi ning 0%<br />
crosstalk). In the same manner, crosstalk of the<br />
red dye into the green channel is defi ned by the<br />
angle of the data cloud with the y-axis.<br />
Fig. 3: Cytofl uorogram shows the intensity relationships<br />
between two channels.