The Early Signs of Right Bundle Branch Block - Chest
The Early Signs of Right Bundle Branch Block - Chest
The Early Signs of Right Bundle Branch Block - Chest

Create successful ePaper yourself
Turn your PDF publications into a flip-book with our unique Google optimized e-Paper software.
<strong>The</strong> <strong>Early</strong> <strong>Signs</strong> <strong>of</strong> <strong>Right</strong> <strong>Bundle</strong> <strong>Branch</strong><br />
<strong>Block</strong><br />
L. Schamroth, M.D., D.Sc.;* D. P Myburgh, M.B.Ch.B.;t and<br />
C. L. Schamroth, M.B.B.Ch.*<br />
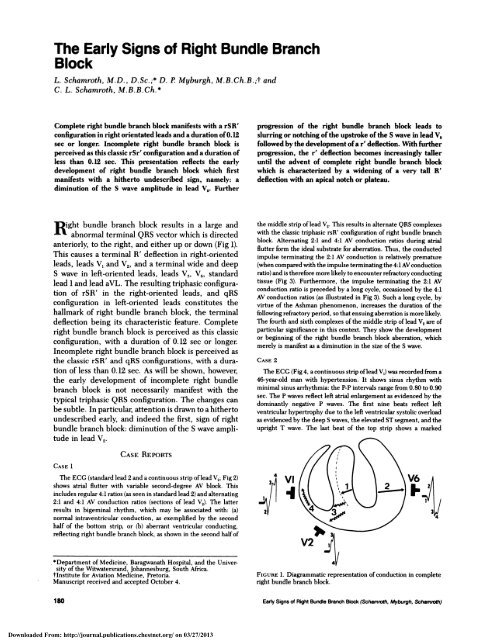
Complete right bundle branch block manifests with a rSR’<br />
configuration in right orientated leads and a duration <strong>of</strong> 0. 12<br />
sec or longer. Incomplete right bundle branch block is<br />
perceived as this classic rSr’ configuration and a duration <strong>of</strong><br />
less than 0.12 sec. This presentation reflects the early<br />
development <strong>of</strong> right bundle branch block which first<br />
manifests with a hitherto undescribed sign, namely: a<br />
diminution <strong>of</strong> the S wave amplitude in lead V2. Further<br />
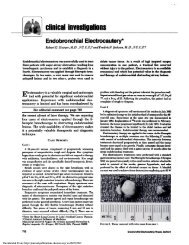
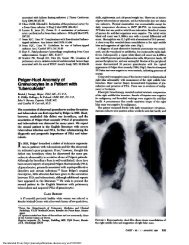
ight bundle branch block results in a large and<br />
abnormal terminal QRS vector which is directed<br />
anteriorly, to the right, and either up or down (Fig 1).<br />
This causes a terminal R’ deflection in right-oriented<br />
leads, leads V, and V2, and a terminal wide and deep<br />
S wave in left-oriented leads, leads V5, V6, standard<br />
lead 1 and lead aVL. <strong>The</strong> resulting triphasic configura-<br />
tion <strong>of</strong> rSR’ in the right-oriented leads, and qRS<br />
configuration in left-oriented leads constitutes the<br />
hallmark <strong>of</strong> right bundle branch block, the terminal<br />
deflection being its characteristic feature. Complete<br />
right bundle branch block is perceived as this classic<br />
configuration, with a duration <strong>of</strong> 0.12 sec or longer.<br />
Incomplete right bundle branch block is perceived as<br />
the classic rSR’ and qRS configurations, with a dura-<br />
tion <strong>of</strong> less than 0.12 sec. As will be shown, however,<br />
the early development <strong>of</strong> incomplete right bundle<br />
branch block is not necessarily manifest with the<br />
typical triphasic QRS configuration. <strong>The</strong> changes can<br />
be subtle. In particular, attention is drawn to a hitherto<br />
undescribed early, and indeed the first, sign <strong>of</strong> right<br />
bundle branch block: diminution <strong>of</strong> the S wave ampli-<br />
tude in lead V2.<br />
CASE 1<br />
CASE REPORTS<br />
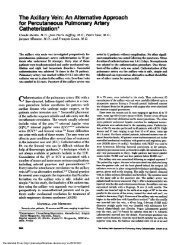
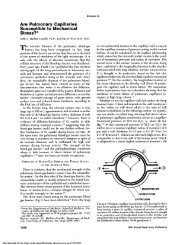
<strong>The</strong> ECG (standard lead 2 and a continuous strip <strong>of</strong>lead V2; Fig 2)<br />
shows atria! flutter with variable second-degree AV block. This<br />
includes regular 4:1 ratios (as seen in standard lead 2) and alternating<br />
2:1 and 4:1 AV conduction ratios (sections <strong>of</strong> lead V,). <strong>The</strong> latter<br />
results in bigeminal rhythm, which may be associated with: (a)<br />
normal intraventricular conduction, as exemplified by the second<br />
half <strong>of</strong> the bottom strip, or (b) aberrant ventricular conducting,<br />
reflecting right bundle branch block, as shown in the second half <strong>of</strong><br />
. *Department <strong>of</strong> Medicine, Baragwanath Hospital, and the Univer-<br />
sity <strong>of</strong> the Witwatersrand, Johannesburg, South Africa.<br />
tlnstitute for Aviation Medicine, Pretoria.<br />
Manuscript received and accepted October 4.<br />
180 <strong>Early</strong> <strong>Signs</strong> <strong>of</strong> <strong>Right</strong> <strong>Bundle</strong> <strong>Branch</strong> <strong>Block</strong> (Schammth, Myburgh, Scharnmth)<br />
Downloaded From: http://journal.publications.chestnet.org/ on 03/27/2013<br />
progression <strong>of</strong> the right bundle branch block leads to<br />
slurring or notching <strong>of</strong>the upstroke <strong>of</strong>the S wave in lead V1<br />
followed by the development <strong>of</strong>a r’ deflection. With further<br />
progression, the r’ deflection becomes increasingly taller<br />
until the advent <strong>of</strong> complete right bundle branch block<br />
which is characterized by a widening <strong>of</strong> a very tall R’<br />
deflection with an apical notch or plateau.<br />
the middle strip <strong>of</strong>lead V2. This results in alternate QRS complexes<br />
with the classic triphasic rsR’ configuration <strong>of</strong> right bundle branch<br />
block. Alternating 2:1 and 4:1 AV conduction ratios during atrial<br />
flutter form the ideal substrate for aberration. Thus, the conducted<br />
impulse terminating the 2:1 AV conduction is relatively premature<br />
(when compared with the impulse terminating the 4:1 AV conduction<br />
ratio) and is therefore more likely to encounter refractory conducting<br />
tissue (Fig 3). Furthermore, the impulse terminating the 2:1 AV<br />
conduction ratio is preceded by a long cycle, occasioned by the 4:1<br />
AV conduction ratios (as i!!ustrated in Fig 3). Such a long cycle, by<br />
virtue <strong>of</strong> the Ashman phenomenon, increases the duration <strong>of</strong> the<br />
following refractory period, so that ensuing aberration is more likely.<br />
<strong>The</strong> fourth and sixth complexes <strong>of</strong>the middle strip <strong>of</strong>lead V1 are <strong>of</strong><br />
particular significance in this context. <strong>The</strong>y show the development<br />
or beginning <strong>of</strong> the right bundle branch block aberration, which<br />
merely is manifest as a diminution in the size <strong>of</strong> the S wave.<br />
CASE 2<br />
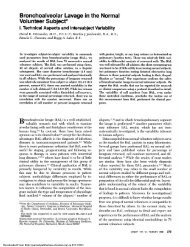
<strong>The</strong> ECG (Fig 4, a continuous strip <strong>of</strong>lead V,) was recorded from a<br />
46-year-old man with hypertension. It shows sinus rhythm with<br />
minimal sinus arrhythmia: the P-P intervals range from 0.80 to 0.90<br />
sec. <strong>The</strong> P waves reflect left atrial enlargement as evidenced by the<br />
dominantly negative P waves. <strong>The</strong> first nine beats reflect left<br />
ventricular hypertrophy due to the left ventricular systolic overload<br />
as evidenced by the deep S waves, the elevated ST segment, and the<br />
upright T wave. <strong>The</strong> last beat <strong>of</strong> the top strip shows a marked<br />
34v1<br />
V2<br />
FIGURE 1. Diagrammatic representation <strong>of</strong> conduction in complete<br />
right bundle branch block.
‘ rgt I<br />
vI<br />
L<br />
1111<br />
14<br />
N<br />
H<br />
j<br />
I.<br />
II<br />
I,<br />
I II<br />
I<br />
I<br />
“ .<br />
I<br />
I<br />
:, #{149}‘<br />
: ‘ i<br />
ii I<br />
FIGURE 2. Electrocardiogram (standard lead 2 and continuous strip <strong>of</strong>lead V2) <strong>of</strong>case 1.<br />
I<br />
I<br />
--4-- - -<br />
E<br />
I<br />
.1<br />
-ri<br />
-UI<br />
I I -<br />
FIGURE 3. Diagram illustrating atria! flutter with alternating 2:1 and 4:1 A\7 conduction ratios.<br />
FIGURE 4. Electrocardiogram (a continuous strip <strong>of</strong> lead V,) <strong>of</strong> case 2.<br />
shortening <strong>of</strong> the S wave with inversion <strong>of</strong> the T wave. This is also<br />
evident in the first two beats <strong>of</strong>the second strip. <strong>The</strong> remaining beats<br />
<strong>of</strong> the second strip, as well as the first four beats <strong>of</strong> the third strip,<br />
show incomplete right bundle branch block, as evidenced by a small<br />
Downloaded From: http://journal.publications.chestnet.org/ on 03/27/2013<br />
‘ I<br />
1-<br />
I I 1<br />
-<br />
_1 t I i ..<br />
i I<br />
terminal r’ deflection. <strong>The</strong> r’ deflection varies in amplitude depend-<br />
ing on the degree <strong>of</strong> incomplete right bundle branch block, and is<br />
more marked when associated with shorter cycles, eg, 0.80 sec. <strong>The</strong><br />
long pause following the ventricular extrasystole in the third strip is<br />
CHEST / 87 / 2 I FEBRUARY, 1985 181
. I :1 1. I<br />
I :I 1.:j<br />
.I<br />
:Ii.J<br />
I.1.:’ITRI<br />
fH.:::UI I.IF;- -<br />
JTiii.I- I ‘flTh<br />
j. ...<br />
.l..1....I “.1- I #{149} , C<br />
1-I----r-----i---r<br />
V.1 . .1<br />
I I<br />
-r--r<br />
1r..H<br />
FIt<br />
j:: I I #{149} :. J I: II#{149}l F :I:.IH ITI I 1<br />
! C I I I I r I I I I II I VI’ . ‘ 1<br />
followed l)) three l)eats which, as before, have a deep S wave. <strong>The</strong><br />
last beat <strong>of</strong>the third strip, as well as the first three beats <strong>of</strong>the bottom<br />
strip, are once again associated with short S waves. In addition, there<br />
is some slurring <strong>of</strong>the ascending limb <strong>of</strong>the S wave as it approaches<br />
the baseline in these beats. <strong>The</strong> last eight heats are yet again<br />
associated with deep S waves.<br />
<strong>The</strong> various QRS manifestations are dependent on critical rate.<br />
Thus, at a sinus cycle <strong>of</strong>0.83 sec or less, the heats have a relatively<br />
short S wave. With a sinus cycle greater than 0.83 sec. the beats have<br />
a deep S wave. <strong>The</strong> manifestations are thus an expression <strong>of</strong> aberrant<br />
ventricular conduction which is dependent on critical rate.<br />
CASE 3<br />
<strong>The</strong> ECG (Fig 5, a continuous strip <strong>of</strong> lead V,) reflects very long<br />
P-P intervals, which range from 1.88 to 2.14 sec. This represents<br />
either (a) a marked sinus bradvcardia <strong>of</strong>28 to 32 heats/minute, or (b) a<br />
sinus rate <strong>of</strong>56 to 64/minute complicated by 2:1 sinoatrial block. <strong>The</strong><br />
first conducted sinus heat is the second beat <strong>of</strong>the top strip. This is<br />
followed by an AV nodal escape beat. <strong>The</strong> ensuing P wave occurs 0.38<br />
sec after the escape beat and is conducted with right bundle branch<br />
block aberration. <strong>The</strong> sequence <strong>of</strong>escape and capture constitutes a<br />
form <strong>of</strong>escape-capture bigeminy <strong>The</strong> next escape heat (the last heat<br />
in the top strip) occurs synchronously with the P wave (concealed<br />
within the QRS complex), whose impulse is consequentl interfered<br />
with and not conducted. <strong>The</strong>se conduction sequences occur<br />
throughout the tracing. <strong>The</strong> capture beats are associated with the<br />
following forms <strong>of</strong> intraventricular conduction:<br />
1. Normal intracentncular conduction: This occurs with the<br />
second beat <strong>of</strong>each strip and the last beat <strong>of</strong>the bottom strip. <strong>The</strong>se<br />
are associated with R-P intervals <strong>of</strong>0.66, 0.62, 0.60, 0.64, and 0.52<br />
sec. respectively.<br />
2. <strong>Right</strong> bundle branch block: This occurs with the fourth heats <strong>of</strong><br />
the first and second strips, which are associated with R-P intervals <strong>of</strong><br />
0.35 sec.<br />
::ll4:;l4::l:<br />
lf.lL<br />
!i I1iI<br />
I I’--h-!-_.(<br />
. I<br />
_,U_I I 1LL<br />
I I __I. I I ‘“ III I I I I I 11<br />
I III I I 1_I I I i I<br />
I II<br />
I L<br />
I I I I<br />
1_i ft<br />
I 1 1 If<br />
I I I I<br />
.:Ifl1 IIIV1<br />
I I’+-ILMll H.i1 H41 ‘+fl<br />
I I L 111 I<br />
‘+-4. ‘$41<br />
Ill I III Itl<br />
k-+’4(Th4<br />
I U I I<br />
4tfl U4IUIU 1itE1fifTh<br />
±H±LLL±iH±E TLLLt±JjHjj44jftLUI!JHU.1ILLL<br />
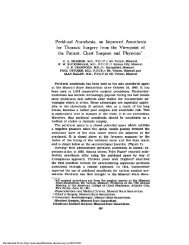
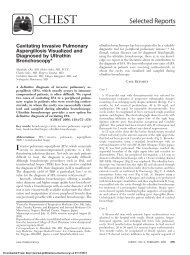
FIGURE 6. Electrocardiogram (a continuous strip <strong>of</strong>lead MCL1) <strong>of</strong>case 4.<br />
182 <strong>Early</strong> <strong>Signs</strong> <strong>of</strong> <strong>Right</strong> <strong>Bundle</strong> <strong>Branch</strong> <strong>Block</strong> (Schamroth, Myburgh, Scharnr<strong>of</strong>h)<br />
Downloaded From: http://journal.publications.chestnet.org/ on 03/27/2013<br />
-<br />
-<br />
U-<br />
FIGURE 5. Electrocardiogram (a continuous strip <strong>of</strong> lead<br />
V,) <strong>of</strong>case 3.<br />
3. Diminished S wave: This is reflected by the fourth beat <strong>of</strong> the<br />
third strip, and is associated with an R-P interval <strong>of</strong>0.38 sec.<br />
<strong>The</strong> form <strong>of</strong>the intraventricular conduction is thus dependent on<br />
the R-P interval. <strong>The</strong> late impulses <strong>of</strong>relatively long R-P intervals are<br />
associated with normal intraventricular conduction. <strong>The</strong> early im-<br />
pulses <strong>of</strong> relatively short R-P intervals are associated with right<br />
bundle branch block conduction. An intermediate R-P interval is<br />
associated with a QRS complex that merely shows a diminished<br />
S wave.<br />
CASE 4<br />
<strong>The</strong> ECG (Fig 6, a continuous strip <strong>of</strong>lead MCL1) shows a basic<br />
fast sinus rhythm in the upper strip. <strong>The</strong> P-P intervals measure 0.66<br />
sec. representing a rate <strong>of</strong>9llminute. <strong>The</strong> second beat in the top strip<br />
is a ventricular extrasystole. <strong>The</strong> rhythm is further complicated by<br />
atrial extrasystoles, which are conducted with right bundle branch<br />
block aberration. <strong>The</strong>se are represented by the 9th and 14th beats in<br />
the top strip, and the 5th and 10th beats in the bottom strip. <strong>The</strong> P<br />
wave <strong>of</strong> each atrial extrasystole is superimposed upon and deforms<br />
the ST segment <strong>of</strong>the preceding beat. <strong>The</strong> second atrial extrasystole<br />
<strong>of</strong>the bottom strip falls during the vulnerable period <strong>of</strong>the atria and<br />
precipitates atrial fibrillation, as is evidenced by the ensuing fast<br />
irregular rhythm. Some <strong>of</strong>the beats during the atrial fibrillation also<br />
reflect the rsR’ configuration <strong>of</strong> right bundle branch block aberra-<br />
tion. <strong>The</strong> fourth beat <strong>of</strong> the top strip is <strong>of</strong> particular interest and<br />
merely reflects a diminution <strong>of</strong>the S wave as the only change. This<br />
beat is preceded by a long cycle occasioned by the pause <strong>of</strong> the<br />
ventricular extrasystole. A long pause, by virtue <strong>of</strong> the Ashman<br />
phenomenon, will increase the ensuing refractoriness and therefore<br />
favor aberration. <strong>The</strong> diminished amplitude <strong>of</strong> the S wave thus<br />
represents a degree <strong>of</strong> aberration which, in view <strong>of</strong> the classic right<br />
bundle branch block aberration associated with the atrial extra-<br />
systoles, represents an early phase <strong>of</strong>right bundle branch block. <strong>The</strong><br />
diminution <strong>of</strong>the S wave in the last beat <strong>of</strong>the top strip and the last<br />
I
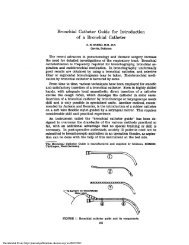
228 A. II _III<br />
AVR AVI. AVE<br />
25.8.1966,!<br />
FIGURE 7. Electrocardiograms <strong>of</strong> case 5.<br />
two beats <strong>of</strong> the bottom strips probably represent the same phe-<br />
nomenon.<br />
B.<br />
I II III AVR AVL AVE<br />
COMMENT<br />
<strong>The</strong> rhythm strips <strong>of</strong> all <strong>of</strong> the cases depicted above<br />
show intermittent right bundle branch block aberra-<br />
tion, during which a diminished S wave in right-on-<br />
ented leads appears as the earliest manifestation <strong>of</strong> in-<br />
complete right bundle branch block. This stimulated<br />
the search for this manifestation in serial 12-lead<br />
ECGs.<br />
CASES 5 TO 8<br />
An analysis <strong>of</strong> 11,000 ECGs <strong>of</strong>healthy aviation personnel yielded<br />
25 cases <strong>of</strong> right bundle branch block. Four <strong>of</strong> these cases had two<br />
preceding ECGs with normal (narrow) QRS configurations, pre-<br />
sented here as cases 5 to 8. <strong>The</strong>se ECGs preceding the complete<br />
right bundle branch block were recorded on two different dates, the<br />
intervening times ranging from one to seven years. An example is<br />
shown in Figure 7. <strong>The</strong> amplitudes <strong>of</strong>the S waves in leads V, and V2<br />
as well as the R waves in lead V, <strong>of</strong>all four cases are shown in Figure<br />
8. All four cases showed a diminution <strong>of</strong> the S wave in lead V2. Two<br />
cases had a diminution <strong>of</strong> the S wave in lead V,, one showed no<br />
change, and one had a minimal increase <strong>of</strong> 1 mm. <strong>The</strong> R wave<br />
amplitude in lead V5 was diminished in two cases and remained the<br />
same in the other two. <strong>Right</strong> bundle branch block was observed in<br />
the tracings <strong>of</strong> all four cases recorded one to five years later.<br />
DIsCUssIoN<br />
<strong>The</strong> right bundle branch block form <strong>of</strong>aberration in<br />
the rhythm strips <strong>of</strong> cases 1 to 4, and the sequential,<br />
time-spaced, 12-lead ECGs <strong>of</strong> cases 5 to 8 reflect the<br />
earliest manifestation <strong>of</strong>right bundle branch block as a<br />
diminution <strong>of</strong> the S wave amplitude in right-oriented<br />
leads, particularly lead V2.<br />
Mechanism<br />
Normal ventricular activation begins in the left side<br />
Downloaded From: http://journal.publications.chestnet.org/ on 03/27/2013<br />
S In<br />
VI<br />
S R In<br />
VS<br />
FIGURE 8. Graphic representation <strong>of</strong>the S wave amplitudes in leads<br />
V, and V2, and the R wave amplitude in lead V, <strong>of</strong> cases 5 to 8.<br />
<strong>of</strong>the interventricular septum and spreads from left to<br />
right through the septum (vector 16, Fig 9). This occurs<br />
near-synchronously with a smaller vector from the<br />
right side in the interventricular septum (vector la, Fig<br />
9). <strong>The</strong> dominant force is thus from left to right and is<br />
responsible for the normal small initial r wave in lead V,<br />
and the normal small initial q wave in lead V6. Septal<br />
activation is followed by paraseptal activation from<br />
endocardial to epicardial surfaces (vectors 2a and 2b,<br />
Fig 9). <strong>The</strong>se paraseptal vectors are larselv responsible<br />
FIGURE 9. Diagrammatic representations <strong>of</strong> normal ventricular<br />
depolarization.<br />
CHEST I 87 1 2 I FEBRUARY, 1985 183
3a+c<br />
vi<br />
FIGURE 10. I)iagrammatic representation <strong>of</strong> ventricular depolarization<br />
in incomplete right bundle branch block.<br />
for the initial r wave in lead V2. This is then followed by<br />
activation <strong>of</strong> the free walls <strong>of</strong> both ventricles from<br />
endocandial to epicardial surfaces (vectors 3a and 3b,<br />
Fig 9). <strong>The</strong> thicker left ventricular wall has a potential<br />
electrical force that is ten times that <strong>of</strong> the free wall <strong>of</strong><br />
the right ventricle. <strong>The</strong> right to left force <strong>of</strong> the left<br />
ventricle thus dominates, resulting in an R wave in lead<br />
V and an S wave in leads V, and V,.<br />
In the case <strong>of</strong> complete right bundle branch block,<br />
conduction through the right bundle branch is no<br />
longer possible. <strong>The</strong> impulse coming from the left side<br />
<strong>of</strong>the interventniculan septum therefore must “jump” a<br />
physiologic intraseptal barrier and then proceed<br />
through ordinary myocardial tissue, in contrast to the<br />
specialized conducting system, to activate the right<br />
ventricle (Fig 1).’ Since ordinary myocardial tissue is a<br />
poor conducting medium, conduction is slow, producing<br />
a relatively large, late, unopposed force.<br />
In the case <strong>of</strong>incomplete right bundle branch block,<br />
however, conduction through the right bundle branch<br />
Fu;URE 11. Diagrammatic representation <strong>of</strong> the various forms <strong>of</strong><br />
right bundle branch block.<br />
is still possible but is delayed. <strong>The</strong> effect <strong>of</strong> this is<br />
shown in Figure 10. Delay within the right bundle<br />
branch causes a delay in the right paraseptal force<br />
(vector 3c, Fig 10) which, as a result, now occurs<br />
311 synchronously with the free wall forces (vectors 3a and<br />
- 1 3b, Fig 10). And since vector 3c is directed slightly<br />
opposite vector 3b, it will diminish the magnitude <strong>of</strong><br />
the resultant vector 3, which is responsible for the<br />
S wave in lead V2. In other words, both vectors 3a and<br />
3c counter vector 3b (Fig 10). A slight delay in<br />
conduction through the right bundle branch will thus<br />
cause a diminution in the S wave <strong>of</strong> lead V,. <strong>The</strong>re<br />
should also be a diminution <strong>of</strong> the R wave in lead V,.<br />
This has previously been noted.2<br />
Diminution <strong>of</strong>the R wave in lead V, was observed in<br />
two <strong>of</strong>the four cases, with no change in the other two.<br />
A possible reason for this lack <strong>of</strong>consistency is that lead<br />
V, is more remote from the heart than lead V2 and thus<br />
subject to more variations in amplitude due to such<br />
factors as variations in body build and the amount <strong>of</strong><br />
intervening lung tissue. <strong>The</strong> same probably applies to<br />
lead V, and requires further study. Since, however, the<br />
right paraseptal vector is the most affected, the effect <strong>of</strong><br />
this would most likely be evident in lead V,, which is<br />
directly oriented to this vector (Fig 9 and 10).<br />
<strong>The</strong> Forms and Progression <strong>of</strong><strong>Right</strong> <strong>Bundle</strong> <strong>Branch</strong><br />
184 <strong>Early</strong> <strong>Signs</strong> <strong>of</strong> <strong>Right</strong> <strong>Bundle</strong> <strong>Branch</strong> <strong>Block</strong> (Schammth, Myburgh, Schamroth)<br />
Downloaded From: http://journal.publications.chestnet.org/ on 03/27/2013<br />
<strong>Block</strong><br />
<strong>The</strong> earliest manifestation <strong>of</strong> right bundle branch<br />
block, and its progression through the phases <strong>of</strong><br />
incomplete right bundle branch block to complete<br />
right bundle branch block, are illustrated in Figure II.<br />
<strong>The</strong> first sign <strong>of</strong>bundle branch block is the diminution<br />
<strong>of</strong> the S wave in lead V2. Further progression <strong>of</strong> the<br />
right bundle branch block leads to slurring or notching<br />
<strong>of</strong> the upstroke <strong>of</strong> the S wave in lead V2 (case 2 and<br />
diagram C, Fig 11). This manifestation previously has<br />
been the earliest described manifestation <strong>of</strong> in-<br />
complete right bundle branch block.3 Further increase<br />
in the right bundle branch block results in an r’<br />
deflection in lead V2, and the QRS complex assumes a<br />
triphasic configuration (case 2, diagram D, Fig II).<br />
With further progression, the r’ deflection becomes<br />
increasingly taller (diagram E, Fig II). Complete right<br />
bundle branch block is characterized by a widening <strong>of</strong><br />
the very tall R’ deflection with an apical notch or<br />
plateau. <strong>The</strong> duration <strong>of</strong> the QRS complex is thereby<br />
increased to 0. 12 sec or longer (diagram F, Fig 11). <strong>The</strong><br />
S wave is much reduced in amplitude and, with the<br />
maximal degree <strong>of</strong> right bundle branch block, may<br />
indeed disappear completely.<br />
<strong>The</strong> development <strong>of</strong> right bundle branch block is<br />
thus characterized empirically by two major manifesta-<br />
tions in lead V2:<br />
1. Progressive diminution <strong>of</strong> the S wave.<br />
2. Progressive enlargement <strong>of</strong>the r’ or R’ wave with
final widening <strong>of</strong> this deflection. This process begins<br />
slightly later than, and overlaps with, the process<br />
leading to diminution <strong>of</strong> the S wave.<br />
ACKNOWLEDGMENT: I am indebted to Dr. Alan Lindsay for the<br />
electrocardiogram shown as Figure 6.<br />
Hemodynamic Monitoring/Patient Care and Pulmonary<br />
Artery Catheterization<br />
This continuing education program will be held at the Johns Hopkins Medical Institutions,<br />
725 North Wolfe Street, Baltimore, March 23-24. Sponsor is the Department <strong>of</strong> Anesthesiology<br />
and Critical Care Medicine, <strong>The</strong> Johns Hopkins Medical Institutions. For information, contact<br />
the Program Coordinator, Office <strong>of</strong> Continuing Education, Turner 22, 720 Rutland Avenue,<br />
Baltimore 21205 (301:955-6046).<br />
Current Status <strong>of</strong> Tissue and Mechanical Heart Valve<br />
Replacement<br />
St. Joseph’s Hospital Foundation and the Division <strong>of</strong> Cardiovascular Surgery will sponsor this<br />
international seminar in Tampa, Florida, April 27. For further information, please contact<br />
Dennis Pupello, M.D., 3001 West Buffalo Avenue, P0 Box 4227, Tampa 33677(813:870-4130 or<br />
875-8988).<br />
REFERENCES<br />
1 Rodriques MI, Sodi-Pallares D. <strong>The</strong> mechanism <strong>of</strong> complete and<br />
Downloaded From: http://journal.publications.chestnet.org/ on 03/27/2013<br />
incomplete bundle branch block. Am Heart J 1952; 44:715<br />
2 Chou T, Helm RA. Clinical vectorcardiography. New York: Grune<br />
& Stratton, 1967:121<br />
3 Sodi-Pallares D, Medrano GA, Bisteni A, Ponce de Leon J.<br />
Deductive and polyparametric electrocardiography. Mexico<br />
City, Mexico: Instituto Nacional de Cardiologia de Mexico,<br />
1970:109<br />
CHEST / 87 / 2 / FEBRUARY, 1985 185